
During the COVID-19 pandemic, the link between politics and health became glaringly obvious. Democrat-leaning “blue” states were more likely to enact mask requirements and vaccine and social distancing mandates. Republican-leaning “red” states were much more resistant to health measures. The consequences of those differences emerged by the end of 2020, when rates of hospitalization and death from COVID rose in conservative counties and dropped in liberal ones. That divergence continued through 2021, when vaccines became widely available. And although the highly transmissible Omicron variant narrowed the gap in infection rates, hospitalization and death rates, which are dramatically reduced by vaccines, remain higher in Republican-leaning parts of the country.
But COVID is only the latest chapter in the story of politics and health. “COVID has really magnified what had already been brewing in American society, which was that, based on where you lived, your risk of death was much different,” says Haider J. Warraich, a physician and researcher at the VA Boston Healthcare System and Brigham and Women’s Hospital in Boston.
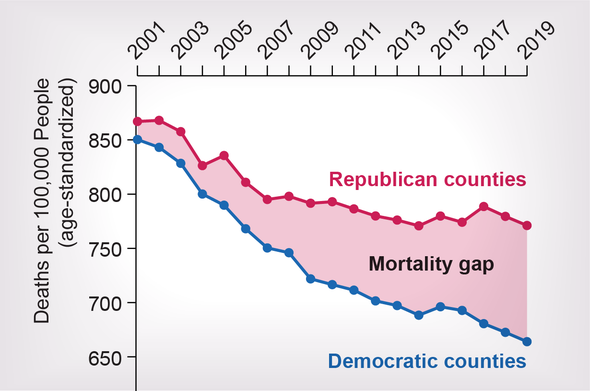
In a study published in June in The BMJ, Warraich and his colleagues showed that over the two decades prior to the pandemic, there was a growing gap in mortality rates for residents of Republican and Democratic counties across the U.S. In 2001, the study’s starting point, the risk of death among red and blue counties (as defined by the results of presidential elections) was similar. Overall, the U.S. mortality rate has decreased in the nearly two decades since then (albeit not as much as in most other high-income countries). But the improvement for those living in Republican counties by 2019 was half that of those in Democratic counties—11 percent lower versus 22 percent lower.
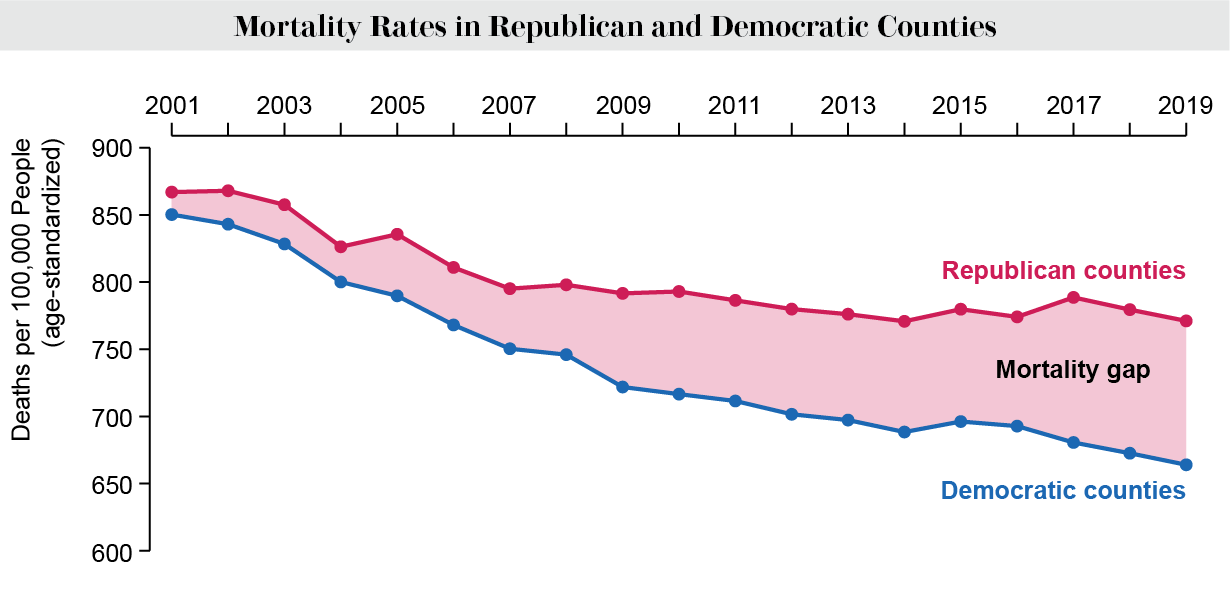
Credit: Amanda Montañez; Source: “Political Environment and Mortality Rates in the United States, 2001-19: Population Based Cross Sectional Analysis,” by Haider J. Warraich et al., in BMJ, Vol. 377. Published online June 7, 2022
The study’s longitudinal approach and county-by-county analysis replicate and extend a clear pattern, says Jennifer Karas Montez, a sociologist and demographer at Syracuse University, who was not involved in the research. “It joins an already existing, pretty robust literature showing that politics [and] polarization do have life-and-death consequences,” Montez says.
The new study, conducted by researchers in Texas, Missouri, Massachusetts and Pakistan, covers the years 2001 through 2019 and examines age-adjusted mortality rates—the number of deaths per 100,000 people each year—from the top 10 leading causes of death, as recorded in 2019. These include heart disease, cancer, lung disease, unintentional injuries and suicide. The researchers then analyzed county-level results in each of the five presidential elections that took place during their study period, identifying counties as Republican or Democratic for the subsequent four years. They found the gap in mortality rates between Republican and Democratic counties increased for nine out of 10 causes of death. (The gap for cerebrovascular disease, which includes stroke and aneurysms, remained but narrowed.) Political environment, the authors suggest in the paper, is a “core determinant of health.”
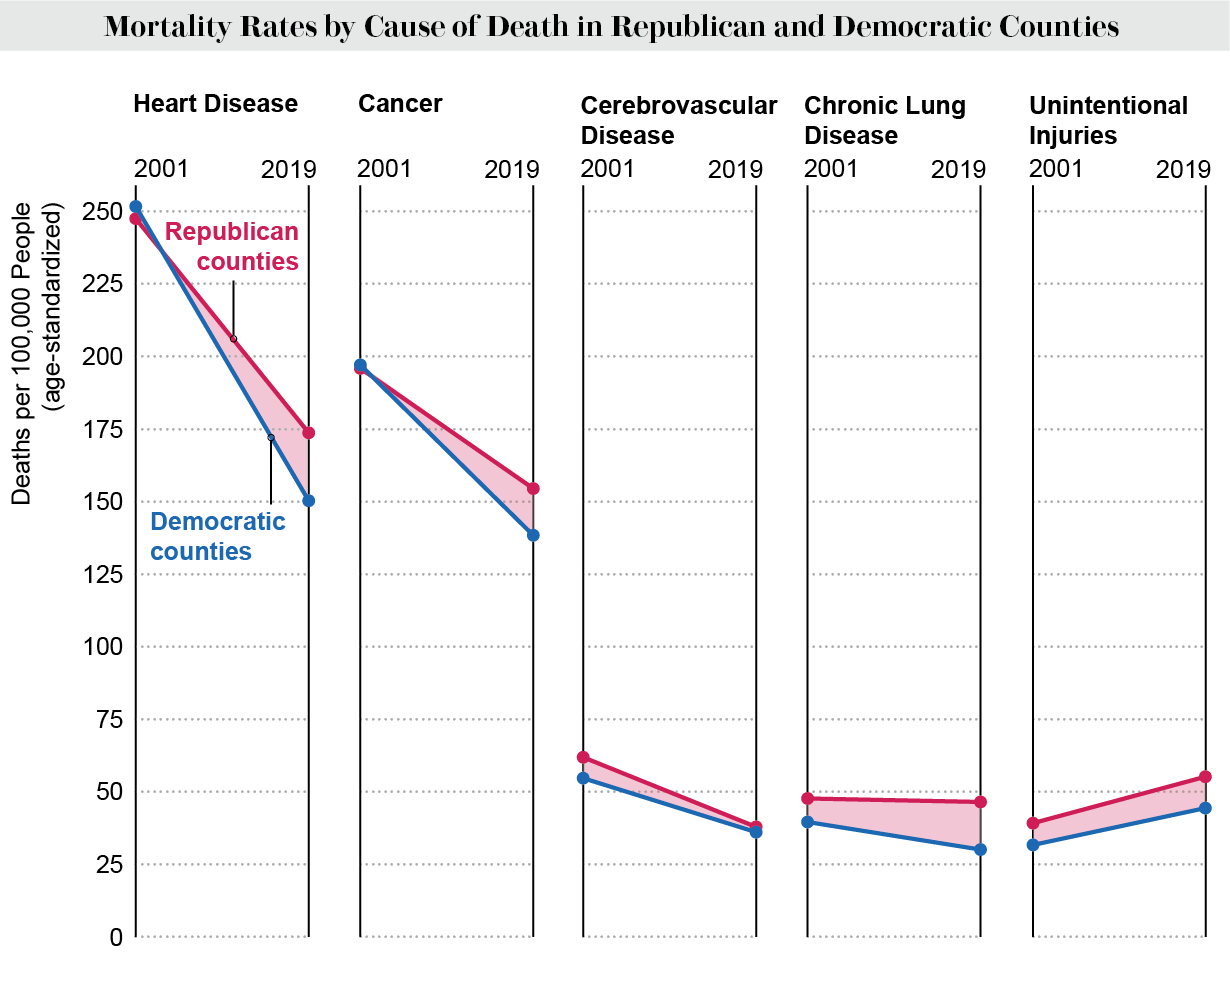
Credit: Amanda Montañez; Source: “Political Environment and Mortality Rates in the United States, 2001-19: Population Based Cross Sectional Analysis,” by Haider J. Warraich et al., in BMJ, Vol. 377. Published online June 7, 2022
What is it about conservative areas that might lead to this disadvantage in health outcomes? Multiple factors probably contribute to the gap. Previous research has found differences between Republican and Democratic regions in health-related behaviors such as exercising or smoking. Those findings were nuanced. For example, Democrats had higher odds of smoking, and Republicans were less likely to exercise. But people living in Republican states, whatever their own political leanings, were more likely to smoke.
And an analysis of the new study’s data by subgroups supports the idea that individual choices play a role. Hispanic Americans everywhere saw significant improvements in their risk of death. Black Americans still have the highest mortality rates of any racial group, but they saw relatively similar improvement. “It didn’t really matter where they lived,” Warraich says. For white Americans, however, the difference was profound—a fourfold increase in the mortality gap between those living in Republican and Democratic areas.
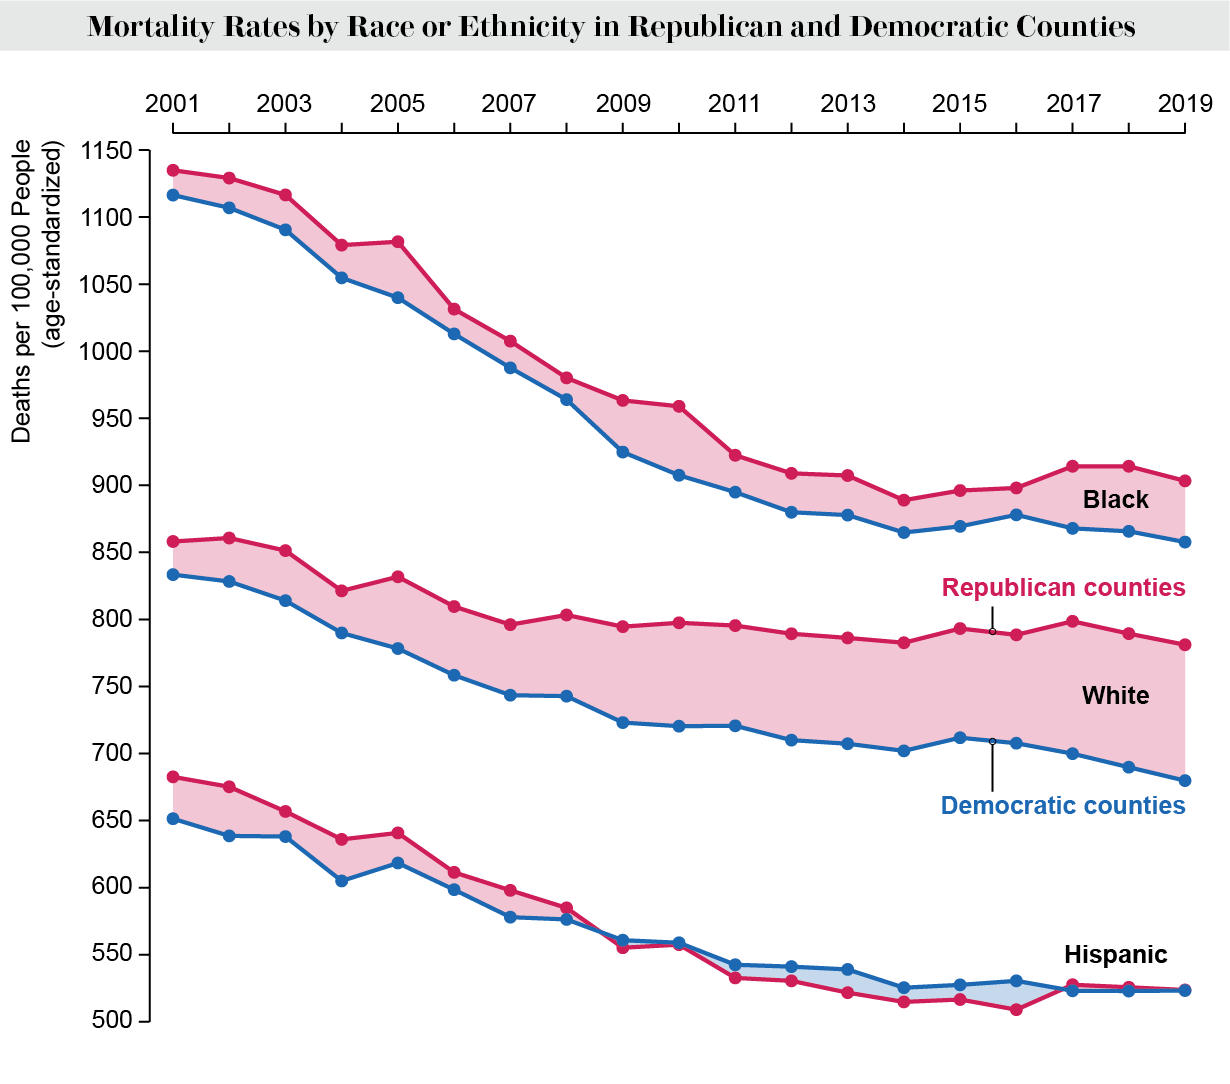
Credit: Amanda Montañez; Source: “Political Environment and Mortality Rates in the United States, 2001-19: Population Based Cross Sectional Analysis,” by Haider J. Warraich et al., in BMJ, Vol. 377. Published online June 7, 2022
Still, experts say some policy choices may have a larger role than individual behavior in causing poor health. As health outcomes such as life expectancy have diverged in recent years, “state policies have been becoming more polarized,” says Steven Woolf, a physician and epidemiologist at Virginia Commonwealth University. In an editorial that accompanied the BMJ paper, Woolf wrote, “Corroborating evidence about the potential health consequences of conservative policies is building.”
In a study that focused on life expectancy in the U.S. between 1970 and 2014 and that also looked at some benchmarks beyond those years, Montez, Woolf and others showed that in 1959 a person in Oklahoma could expect to live, on average, about the same number of years as a person in similar circumstances who lived in Connecticut. And both states performed relatively well, compared to the other 48. But by 2017 Connecticut’s citizens had a five-year advantage in life expectancy over their peers in Oklahoma, which is a politically conservative state. They were near the top of the chart, whereas Oklahomans were near the bottom.
In the intervening decades liberal states enacted more policies to address health concerns while conservative states went in the opposite direction, with inflection points in the early 1980s 1994 and 2010. Montez notes that those dates line up with Ronald Reagan’s election as U.S. president, Newt Gingrich’s control of Congress and the rise of Tea Party politics. Political affiliation drives social policies and spending, says Lois Lee, a pediatric emergency physician at Boston Children’s Hospital and Harvard Medical School. Conservatives tend to see health as a matter of individual responsibility and to prefer less government intervention. Liberals often promote the role of government to implement regulations to protect health. The Democratic approach has included expanding Medicaid under the Affordable Care Act. Access to health care and having health insurance are important for well-being, Warraich says. Democrats also spend more on what are known as the social determinants of health. “We know things like your housing situation, your socioeconomic status, your access to healthy foods and healthy lifestyles, as well as exposure to toxic stress—all these things affect your overall physical as well as emotional and mental health,” Lee says.
Several kinds of policies—around tobacco, labor laws, the environment and guns—repeatedly emerge as significant. “Each party has bundled multiple policies together,” Montez says. In Mississippi, for example, there are no statewide clean indoor air policies restricting smoking in bars, restaurants or workplaces, Montez says. In California, on the other hand, smoking is restricted in all three environments. Cigarette taxes also differ dramatically. “The places where you can’t smoke indoors are also the places where cigarettes cost a lot,” Montez says.
As with COVID, the divergence between states over gun safety laws is dramatic. Firearms contribute to deaths from suicide and unintentional injury and to many nonlethal injuries. Blue states are more likely to require background checks, whereas red states more often allow concealed carry of guns. With gun laws, too, researchers are beginning to look at the effects of policies in aggregate, says Garen Wintemute, emergency physician and director of the Violence Prevention Research Program at the University of California, Davis. “Before California enacted a suite of laws regulating firearms and their ownership and use in the late 1980s and early 1990s, firearm violence mortality rates here were higher than in the rest of the country,” he says. “After those laws were enacted, rates plummeted in California.” The most likely explanation, which Wintemute hopes to test, is that the laws were in part responsible. Until recently, that kind of research has been severely curtailed by the Dickey Amendment, a 1996 addition to a federal spending bill that effectively prevented the Centers for Disease Control and Prevention from conducting research on firearm violence. Congress clarified the law in 2018, paving the way for research funding. “Things are modestly looking up,” Wintemute says. “The CDC and [National Institutes of Health] both have small amounts of research funding and are using it.”
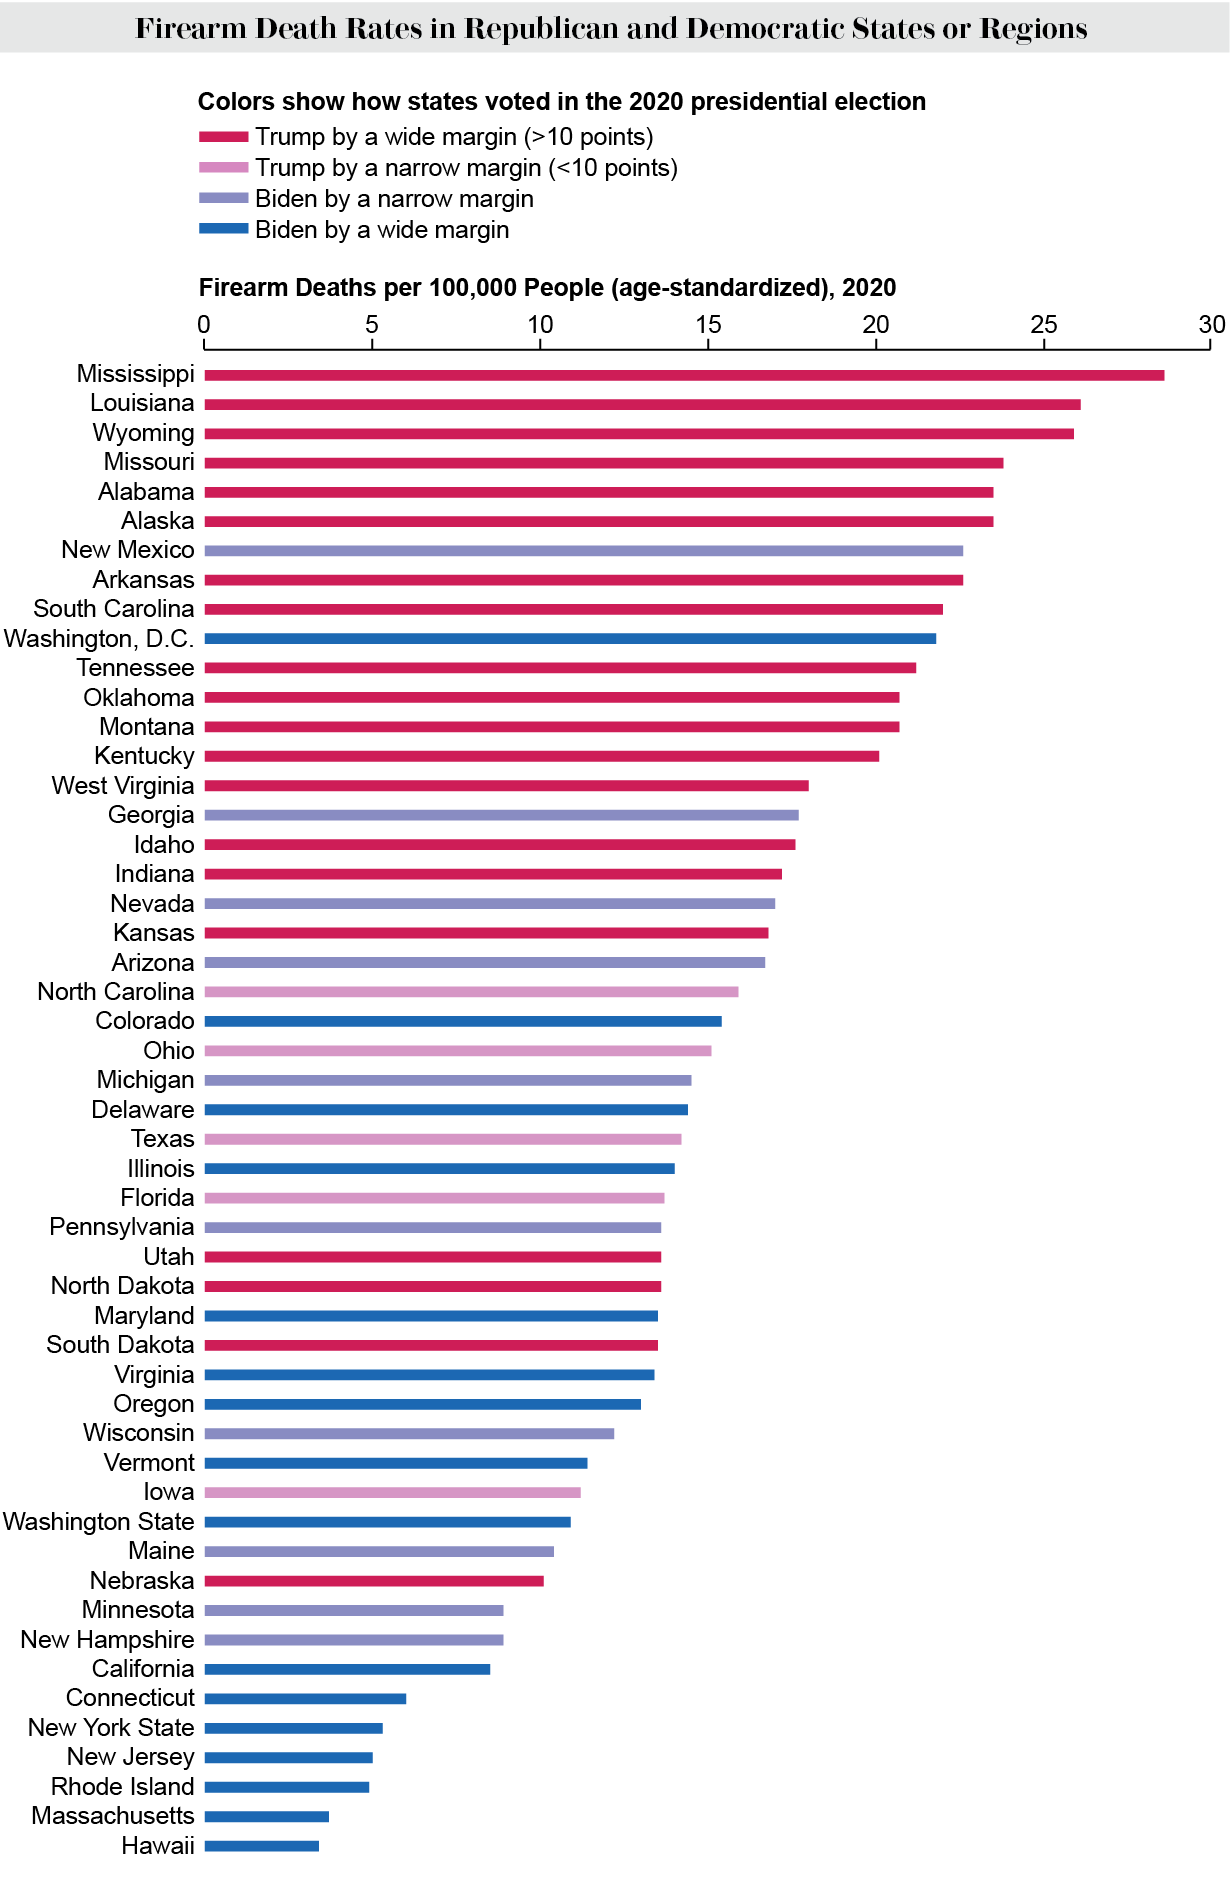
Credit: Amanda Montañez; Source: Web-Based Injury Statistics Query and Reporting System, Centers for Disease Control and Prevention (firearm death data); The Cook Political Report (2020 election data)
Cultural differences between red and blue counties also likely contributed to COVID deaths. “You’re affected by your neighbors,” says Neil Sehgal, a public health professor at the University of Maryland and co-author of a recent study of the association between COVID mortality and county-level voting. Sehgal and his colleagues found that through October 2021, majority-Republican counties experienced 72.9 additional deaths per 100,000 people relative to majority-Democratic counties. To the researchers’ surprise, however, vaccine uptake explained only 10 percent of the difference. The finding suggests that differences in COVID outcomes are driven by a combination of factors, including the likelihood of, say, engaging in unmasked social events or in-person dining, Sehgal says. By February 2022 the COVID death rate in all counties Donald Trump won in the 2020 presidential election was substantially higher than in counties that Joe Biden won—326 deaths per 100,000 people versus 258. “COVID was probably the most dramatic example I’ve seen in my career of the influence of policy choices on health outcomes,” Woolf says.
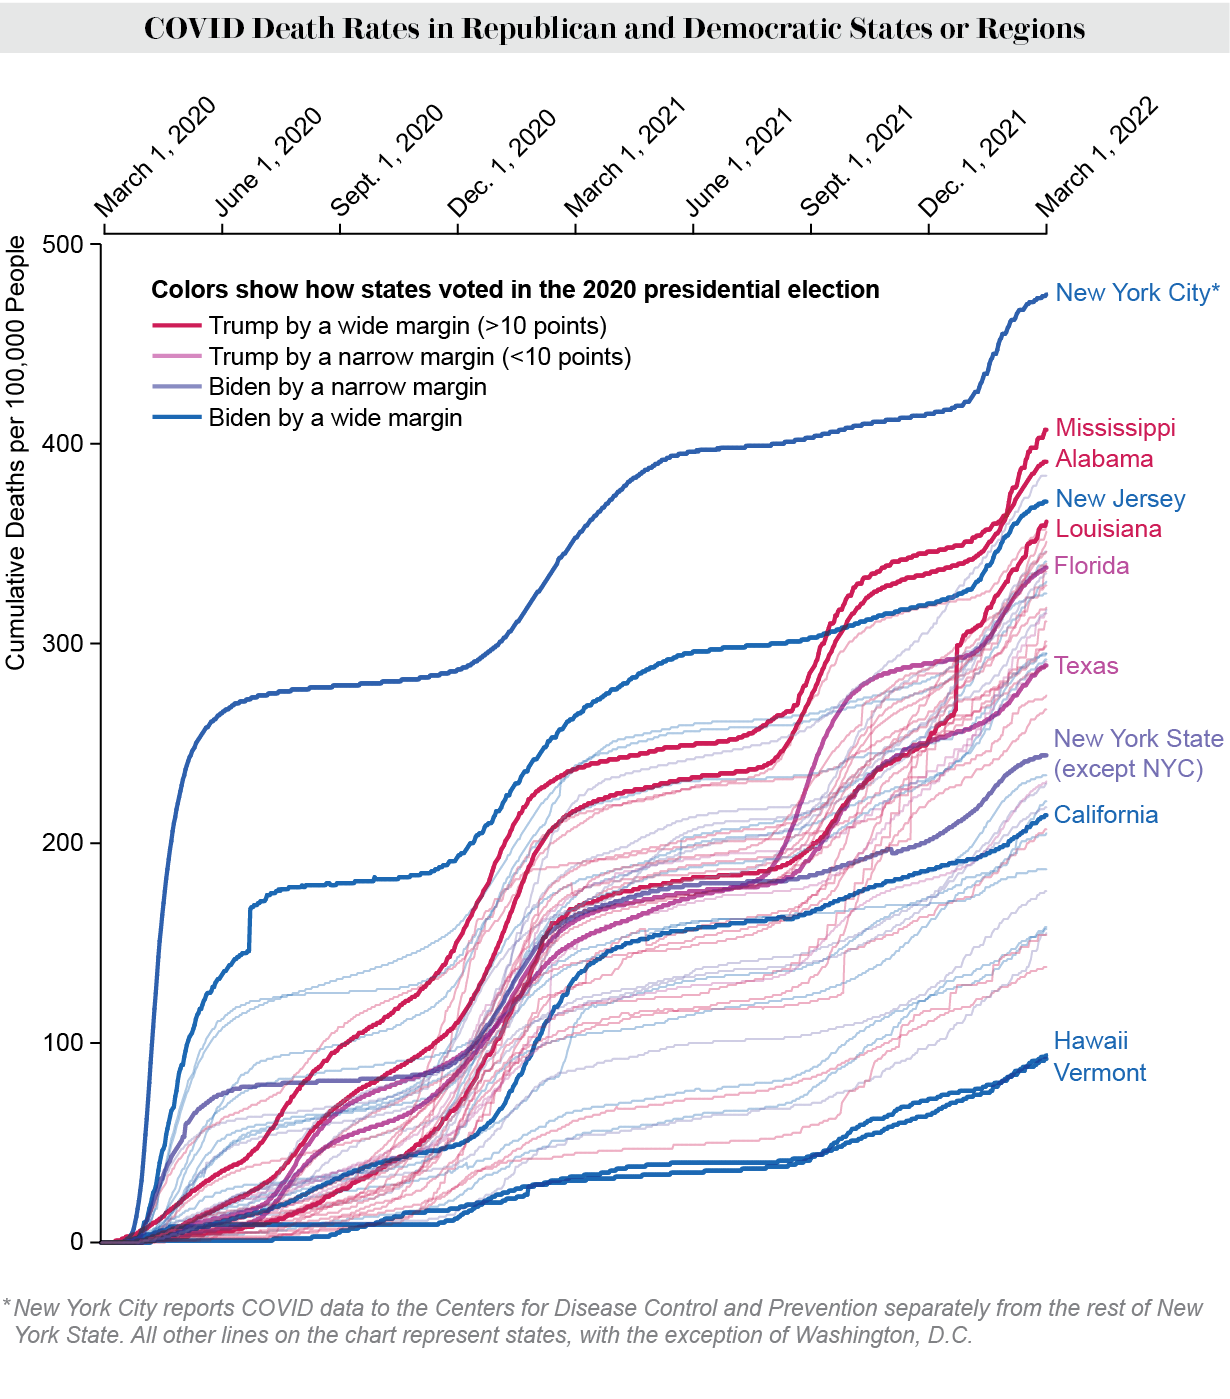
Credit: Amanda Montañez; Source: COVID Data Tracker, Centers for Disease Control and Prevention (COVID death data); The Cook Political Report (2020 election data)
A key takeaway from these studies is that the partisan mortality gap doesn’t have to keep growing. “As a public health expert and as a physician, it doesn’t matter to me whether my patient is a Republican or Democrat,” Warraich says. “I want the best outcome for both of those patients and both of those communities.” Acknowledging the mortality gap, as challenging as that is in our polarized environment, is the first step toward engaging with solutions, he says. “The worst thing that could happen is that [the BMJ study] just becomes labeled as political or partisan,” he says—“and that the people who really need to look at these findings ignore it because it is providing a truth that is uncomfortable or difficult to interpret.”


 +3/-1 TheCrow 10/15/2022 8:42:22 PM