Click here to close
New Message Alert
List Entire Thread
Msg ID: 2692165 Climate explained: what the world was like the last time carbon dioxide le +4/-2     
Author:TheCrow
6/10/2021 11:57:45 AM

According to lalla o-muji-dmmiezombie "carbon dioxide is not a pollutant"- semantics which don't affect the effect. Carbon dioxide is a greenhouse gas, which is what the science is arguing- is ut anthropomorphic? If so, what can be done about it?

If not anthropomorphic and it's an unevitable natural cycle, what will the effects be and how could we deal with those effects?

History provides some clues....

Gil.K/Shutterstock
CC BY-ND

Climate Explained is a collaboration between The Conversation, Stuff and the New Zealand Science Media Centre to answer your questions about climate change.

If you have a question you’d like an expert to answer, please send it to climate.change@stuff.co.nz


What was the climate and sea level like at times in Earth’s history when carbon dioxide in the atmosphere was at 400ppm?

The last time global carbon dioxide levels were consistently at or above 400 parts per million (ppm) was around four million years ago during a geological period known as the Pliocene Era (between 5.3 million and 2.6 million years ago). The world was about 3℃ warmer and sea levels were higher than today.

Political analysis, without partisanship

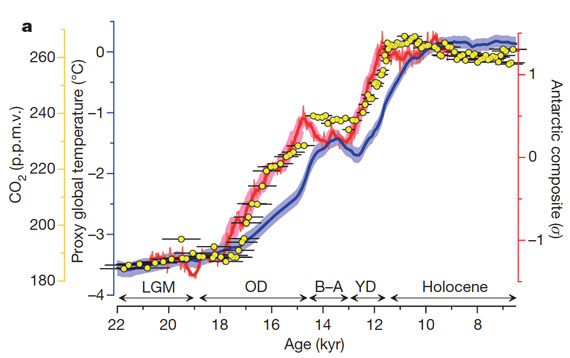
We know how much carbon dioxide the atmosphere contained in the past by studying ice cores from Greenland and Antarctica. As compacted snow gradually changes to ice, it traps air in bubbles that contain samples of the atmosphere at the time. We can sample ice cores to reconstruct past concentrations of carbon dioxide, but this record only takes us back about a million years.


Read more: Climate explained: what caused major climate change in the past?


Beyond a million years, we don’t have any direct measurements of the composition of ancient atmospheres, but we can use several methods to estimate past levels of carbon dioxide. One method uses the relationship between plant pores, known as stomata, that regulate gas exchange in and out of the plant. The density of these stomata is related to atmospheric carbon dioxide, and fossil plants are a good indicator of concentrations in the past.

Another technique is to examine sediment cores from the ocean floor. The sediments build up year after year as the bodies and shells of dead plankton and other organisms rain down on the seafloor. We can use isotopes (chemically identical atoms that differ only in atomic weight) of boron taken from the shells of the dead plankton to reconstruct changes in the acidity of seawater. From this we can work out the level of carbon dioxide in the ocean.

The data from four-million-year-old sediments suggest that carbon dioxide was at 400ppm back then.

Sea levels and changes in Antarctica

During colder periods in Earth’s history, ice caps and glaciers grow and sea levels drop. In the recent geological past, during the most recent ice age about 20,000 years ago, sea levels were at least 120 metres lower than they are today.

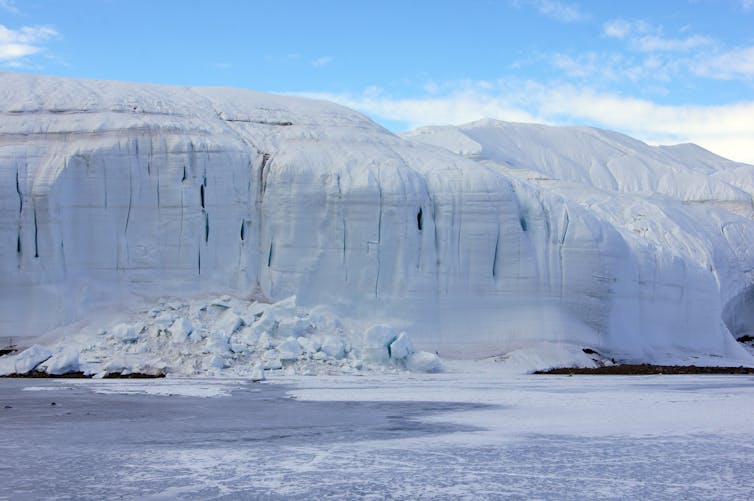
Recent research shows that west Antarctica is now melting. Elaine Hood/NSF

Sea-level changes are calculated from changes in isotopes of oxygen in the shells of marine organisms. For the Pliocene Era, research shows the sea-level change between cooler and warmer periods was around 30-40 metres and sea level was higher than today. Also during the Pliocene, we know the West Antarctic Ice Sheet was significantly smaller and global average temperatures were about 3℃ warmer than today. Summer temperatures in high northern latitudes were up to 14℃ warmer.

This may seem like a lot but modern observations show strong polar amplification of warming: a 1℃ increase at the equator may raise temperatures at the poles by 6-7℃. It is one of the reasons why Arctic sea ice is disappearing.


Read more: Climate explained: why carbon dioxide has such outsized influence on Earth's climate


Impacts in New Zealand and Australasia

In the Australasian region, there was no Great Barrier Reef, but there may have been smaller reefs along the northeast coast of Australia. For New Zealand, the partial melting of the West Antarctic Ice Sheet is probably the most critical point.

One of the key features of New Zealand’s current climate is that Antarctica is cut off from global circulation during the winter because of the big temperature contrast between Antarctica and the Southern Ocean. When it comes back into circulation in springtime, New Zealand gets strong storms. Stormier winters and significantly warmer summers were likely in the mid-Pliocene because of a weaker polar vortex and a warmer Antarctica.

It will take more than a few years or decades of carbon dioxide concentrations at 400ppm to trigger a significant shrinking of the West Antarctic Ice Sheet. But recent studies show that West Antarctica is already melting.

Sea-level rise from a partial melting of West Antarctica could easily exceed a metre or more by 2100. In fact, if the whole of the West Antarctic melted it could raise sea levels by about 3.5 metres. Even smaller increases raise the risk of flooding in low-lying cities including Auckland, Christchurch and Wellington.

Help us spread facts

The COVID-19 pandemic shows the vital importance of reliable, research-based information. We work only with recognized experts – epidemiologists, immunologists, public health scholars and others – to bring you information that is fact-based, accurate and 100% independent. Your monthly – or one-time – donation supports our work. Thank you.

Martin La Monica

Deputy Editor for science coverage


Return-To-Index  
 
Msg ID: 2692167 P.S. Water is not pollution either, but there's a word for too much- flood. (NT) +3/-1     
Author:TheCrow
6/10/2021 11:58:37 AM

Reply to: 2692165


Return-To-Index  
 
Msg ID: 2692220 When Warming Occurs, More Co2 Is Going… +2/-2     
Author:obumazombie
6/10/2021 8:09:04 PM

Reply to: 2692165

To be produced.

The warming precedes higher Co2 levels.

Co2 is NOT a greenhouse gas.

If it was, there could NOT have been a 2 year global cooling period as recently as 2016-2018.

Furthermore, any warming trends will stir cooling effects that offset them.

More heat brings more clouds which blocks sun which cools the heat.

That is just 1 element of integrated systems that have complex buffer mechanisms that libz try to reduce to bumper stickers like glow bull warming, and Co2 is poison, and Co2 is a greenhouse gas.

Its not working lib.

You cannot gaslight those who are trained in the wiles of lib scammers.

Try some other, newer, more creative scam, lib.

Try bitcoin or some other swindle, then make it out to be a...


 Good job Goodlibs!


Return-To-Index  
 
Msg ID: 2692225 When Warming Occurs, More Co2 Is Going… +2/-2     
Author:obumazombie
6/10/2021 8:37:47 PM

Reply to: 2692220


CO2 lags temperature - what does it mean?

What the science says...

Select a level...

 Basic


 Intermediate


 Advanced    

CO2 didn't initiate warming from past ice ages but it did amplify the warming. 
In fact, about 90% of the global warming followed the CO2 increase.

Climate Myth...

CO2 lags temperature

"An article in Science magazine illustrated that a rise in carbon dioxide did not precede a rise in temperatures,

but actually lagged behind temperature rises by 200 to 1000 years. 

A rise in carbon dioxide levels could not have caused a rise in temperature if it followed the temperature."

(Joe Barton, US House of Representatives (Texas) 1985-2019) - Full Statement


Earth’s climate has varied widely over its history,

from ice ages characterised by large ice sheets covering many land areas, to warm periods with no ice at the poles.

Several factors have affected past climate change, including solar variability, volcanic activity and changes in the composition of the atmosphere.

Data from Antarctic ice cores reveals an interesting story for the past 400,000 years.

During this period, CO2 and temperatures are closely correlated, which means they rise and fall together.

However, based on Antarctic ice coredata, changes in CO2 follow changes in temperatures by about 600 to 1000 years, as illustrated in Figure 1 below.

This has led some to conclude that CO2 simply cannot be responsible for current global warming.

Figure 1: Vostok ice core records for carbon dioxide concentration and temperature change.

This statement does not tell the whole story.

The initial changes in temperature during this period are explained by changes in the Earth’s orbit around the sun,

which affects the amount of seasonal sunlight reaching the Earth’s surface.

In the case of warming, the lag between temperature and CO2 is explained as follows: as ocean temperatures rise,

oceans release CO2 into the atmosphere. In turn, this release amplifies the warming trend, leading to yet more CO2 being released.

In other words, increasing CO2 levels become both the cause and effect of further warming.

This positive feedback is necessary to trigger the shifts between glacials and interglacials,

as the effect of orbital changes is too weak to cause such variation.

Additional positive feedbacks which play an important role in this process include other greenhouse gases,

and changes in ice sheet cover and vegetation patterns.

2012 study by Shakun et al. looked at temperature changes 20,000 years ago

(the last glacial-interglacial transition)

from around the world and added more detail to our understanding of the CO2-temperature change relationship. 

They found that:

  • The Earth's orbital cycles triggered warming in the Arctic approximately 19,000 years ago,
  • causing large amounts of ice to melt, flooding the oceans with fresh water.  
  • This influx of fresh water then disrupted ocean current circulation,
  • in turn causing a seesawing of heat between the hemispheres.
  • The Southern Hemisphere and its oceans warmed first, starting about 18,000 years ago. 
  • As the Southern Ocean warms, the solubility of CO2 in water falls. 
  • This causes the oceans to give up more CO2, releasing it into the atmosphere

While the orbital cycles triggered the initial warming,

overall, more than 90% of the glacial-interglacial warming occured after that atmospheric CO2 increase (Figure 2).

Shakun Fig 2a 

Figure 2: Average global temperature (blue), Antarctic temperature (red), and atmospheric CO2 concentration (yellow dots).  Source.

There you have it, libz.

The basis for yet another...


Good job Goodlibs!


Return-To-Index