| Msg ID: 2712670 |
Biden�s economy +1/-3

|
| Author:Old Guy
12/4/2021 10:46:02 AM |
More than 100 million , No Job, Not Looking. The Labor Participation Rate reached a high during the Trump-era. Must have been reasons why more people went to work. It is a number Biden is not improving! After the job loss from the virus it has only gained 0.2 now that Biden is in office. A good question is, Why are so many people not in the work force? Biden's Far-Left socialist agend has incentivized Americans to stay out of the workforce. Even CNN Biden's propaganda wing of the news, said it is a disappointing economy: "Less than expected....." lt is a downshift......." "Low, slow growth....." Here is Biden's economy By the numbers ---GDP came in at a disappointing 2% Less than the predicted 2.7% Lowest growth rate since the pandemic era recovery After taxes and inflation income decreased 5.6% in the third quarter The economy was $600 billion short of Biden's own promises ---inflation is skyrocking Average America households are paying $175 more a month on food, fuel, and housing. That is over $2,000 a year Americans are paying. -----jobs September report added just 194,000 compared to the 500,000 expected. This was the worst jobs report of Biden's presidency. The Labor participation rate fell to 61.6%. Oh! But you useful idiots will claim, the stock market hit new highs! Why don't you figure in the loss in value of the US dollar because of inflation and then post how much in real dollars the market went up or down! Pay your taxes, you voted for it!
|
|
|
Return-To-Index |
| Msg ID: 2712673 |
Ignorance is bliss +3/-0
|
| Author:bladeslap
12/4/2021 11:39:56 AM Reply to: 2712670 |
Let's talk about the labor participation rate when Trump left office Let's talk about unemployment when Trump left office Let's talk about GDP grwoth in Trump's term in office Let's talk about peak unemployment when Trump was in office .... You can't and won't
|
|
|
Return-To-Index |
| Msg ID: 2712678 |
Just hoe ignorant are you? +1/-2
|
| Author:Old Guy
12/4/2021 12:50:56 PM Reply to: 2712673 |
If you ignore the contraction from the pandemic, Biden does not even come close to Trump. Twist numbers all you want, when Bidens far left programs take place the economy will slow more and possibly collapse. There is signs in every economic indicator that the economy is slowing as we post. And of course you fail to understand that much of the economy is operating under the Trump economy policies. Much of Biden's policies cannot even get through a democratic house. What he has done has produced failures, such as inflation, his mandates are in part responsible for the supply issues and his social handouts responsible for the labor shortage. Like Obama he is adding more to the debt then we can support. I really think you have NO real understanding of the economy, you have posted incorrect biased link after incorrect biased link. Let's look at GDP growth from the point of view of fed interest rate. Once Trump took office and the economy started to rapidly grow, to slow it down the interest was increased over and over again, slowing the economy down. Now with Biden it is back to near 0. So, all the bankers that make up the Federial Reserve think just like I do. Trumps economy was good they had to take action to keep from overcooking. But Biden's economy is so bad that they need to help it out all they can, before it collapses. You do realize that the GDP under Trump went Up 33.8% in one quarter as he took control of the pandemic, but. now under Biden it dropped down to 2%. I am more than happy to discuss economic issues with you, you just need to drop the BS biased links that lead you to a incorrect point of view.
|
|
|
Return-To-Index |
| Msg ID: 2712686 |
"Just hoe ignorant are you?" Exactly. +3/-0
|
| Author:TheCrow
12/4/2021 1:59:00 PM Reply to: 2712678 |
"If you ignore the contraction from the pandemic, Biden does not even come close to Trump." The pandemic recession is exactly the sort of immediate short term diversion from the long term economic trend that could result from dumassery, like ignoring, minimizing an impending epidemic: US 2020 election: The economy under Trump in six chartsBy Reality Check team Published3 November 2020
 Claim: President Trump says he built the greatest ever US economy prior to the coronavirus outbreak and that now it's recovering faster than ever. Reality Check verdict: It's true the economy was doing well prior to the pandemic - continuing a trend which began during the Obama administration - but there have been periods when it was much stronger. The US economy was then hit by the biggest economic contraction ever recorded as a result of the pandemic. It has since bounced back strongly, but hasn't regained all its losses. We've looked at the economy in six key charts.  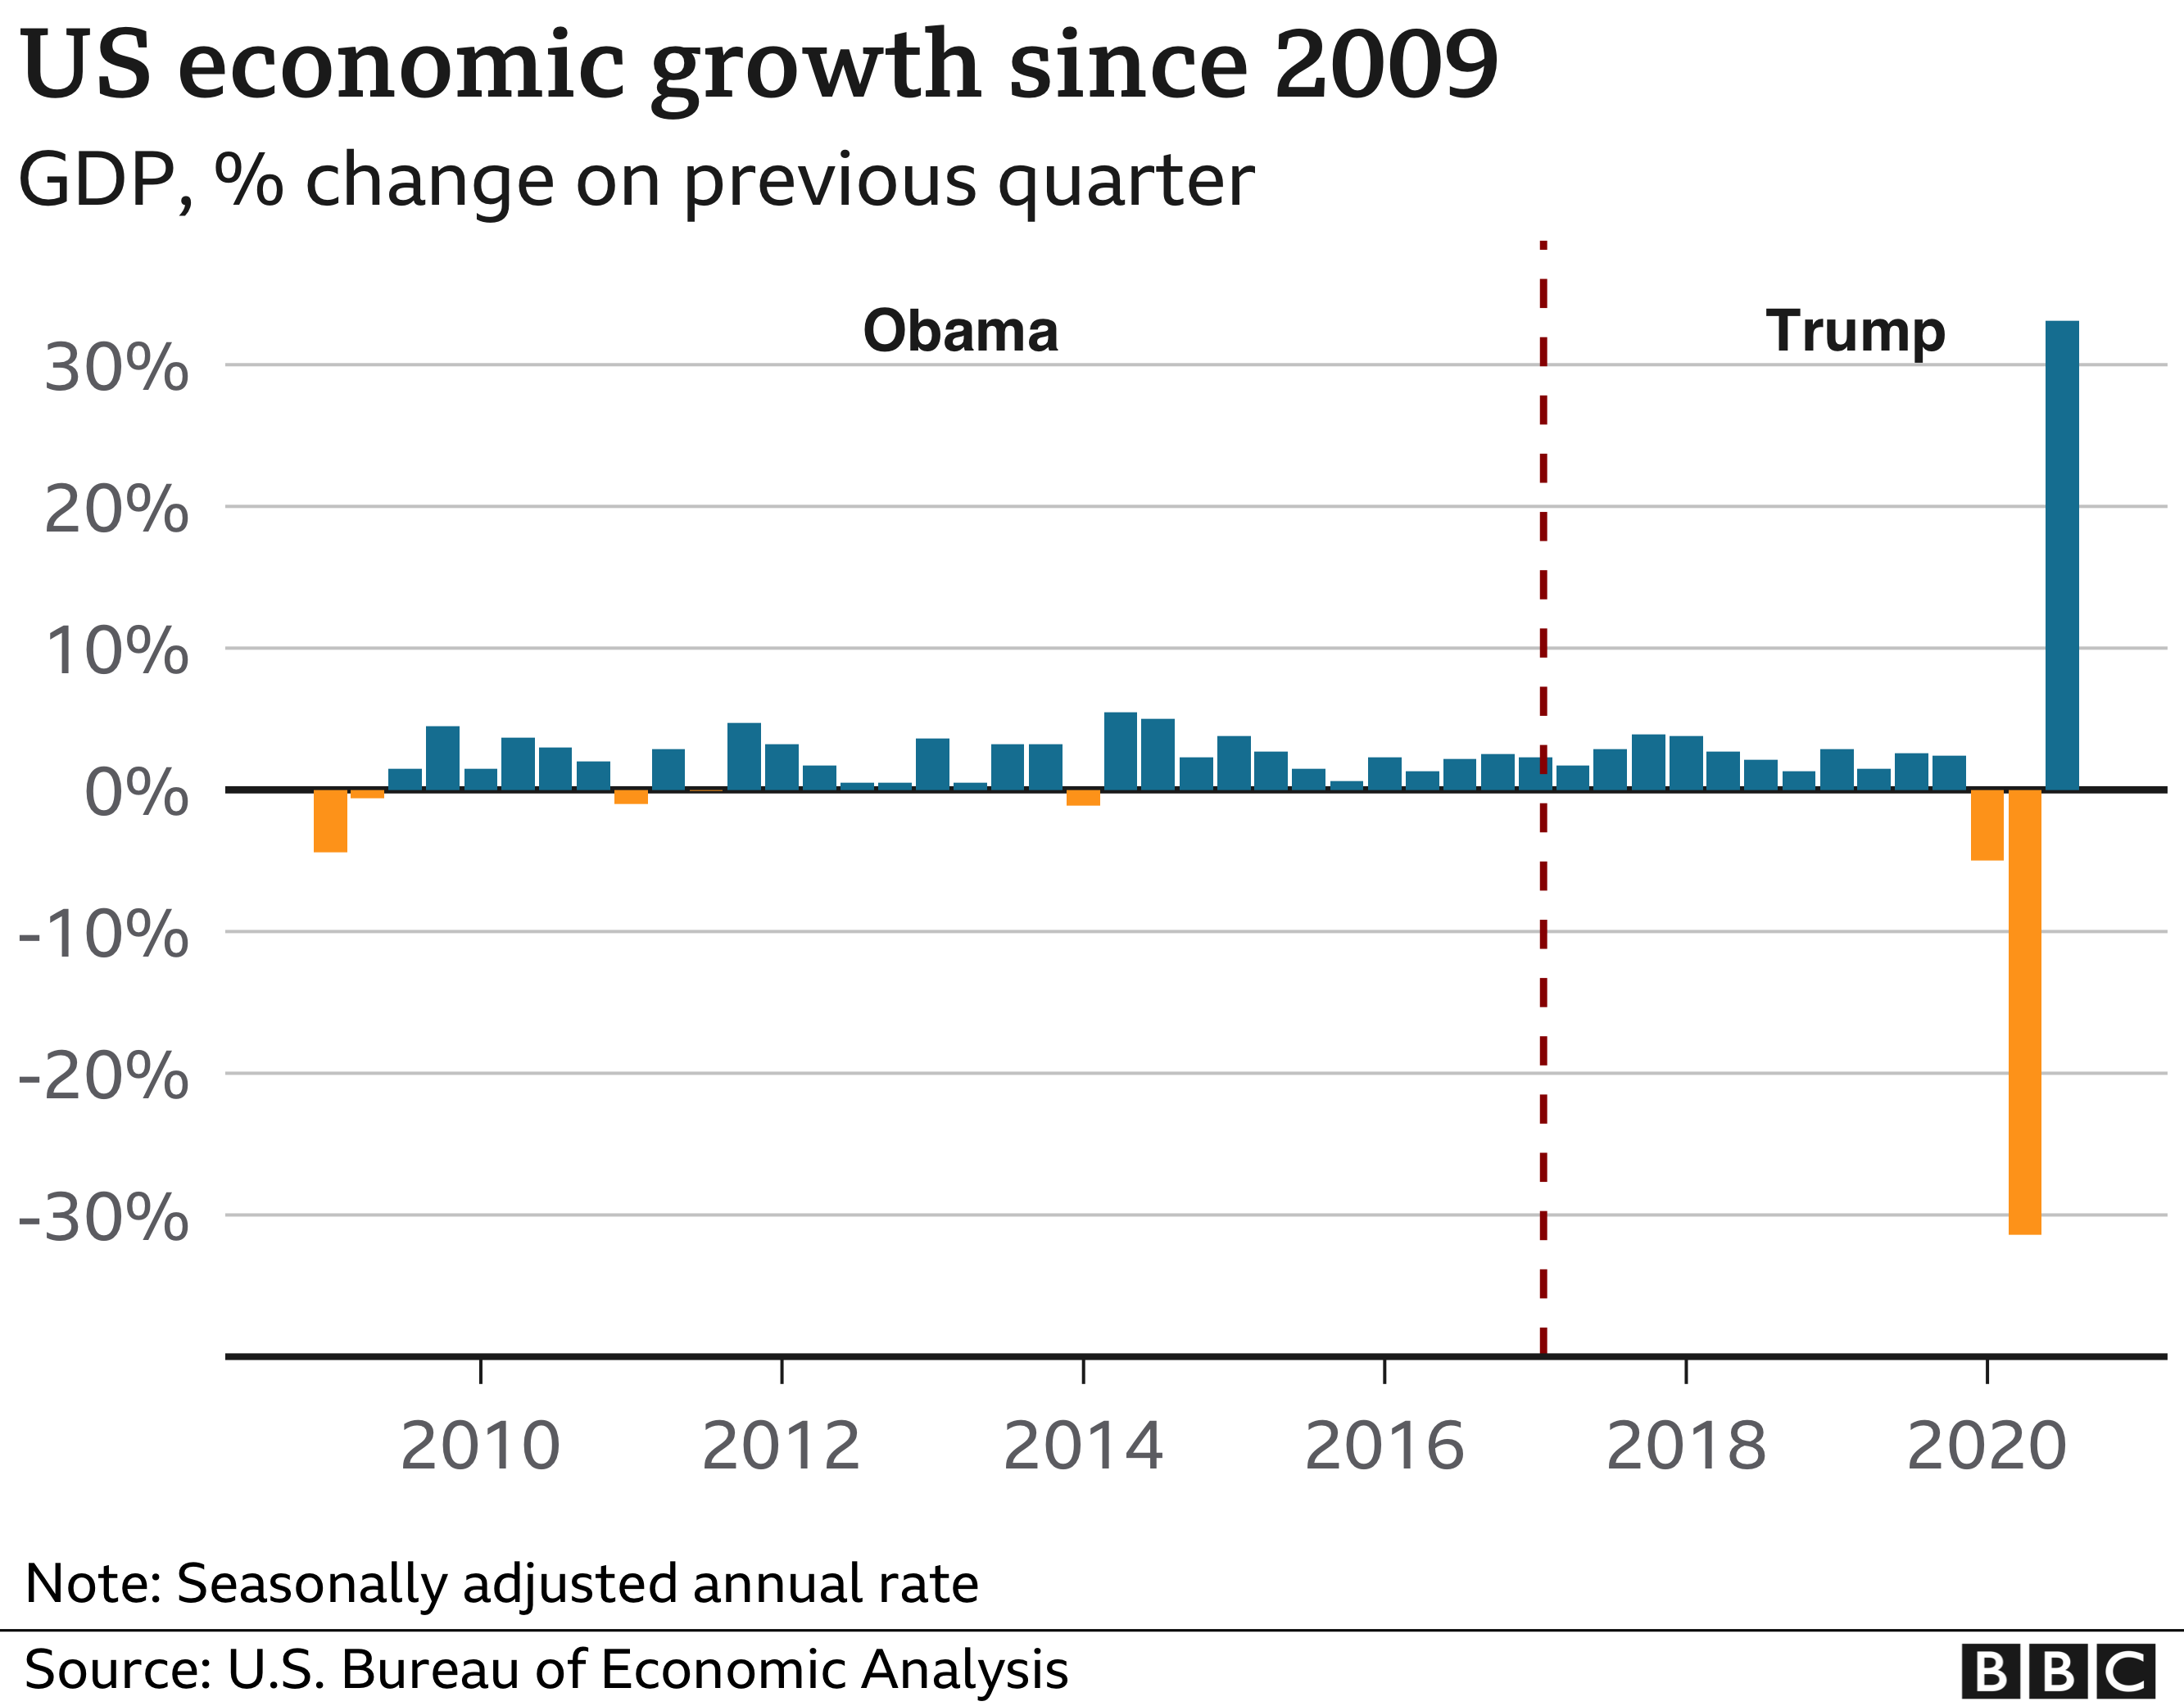 The latest numbers show economic output surged by an annualised 33% in the third quarter of 2020, following a record fall as a consequence of the coronavirus pandemic. The recovery, although strong, hasn't yet brought economic activity back to pre-pandemic levels. Mr Trump has said the recent recovery in growth is "the biggest in the history of our country by almost triple...that's bigger than any nation". Yes, it is the biggest quarterly increase, but by more like double - outdoing the previous peak of 16.7% in the first quarter of 1950.
However, Mr Trump's comparison with other countries isn't right. From July to September this year, the economy grew by 7.4% in the US (33.1% is the annualised figure). This is less than Germany, Italy and the eurozone as a whole. If you look at economic growth from the start of the pandemic to the present, the US has done better than Europe but "worse that China and some other Asian economies" such as South Korea, says Neil Shearing, chief economist at Capital Economics. 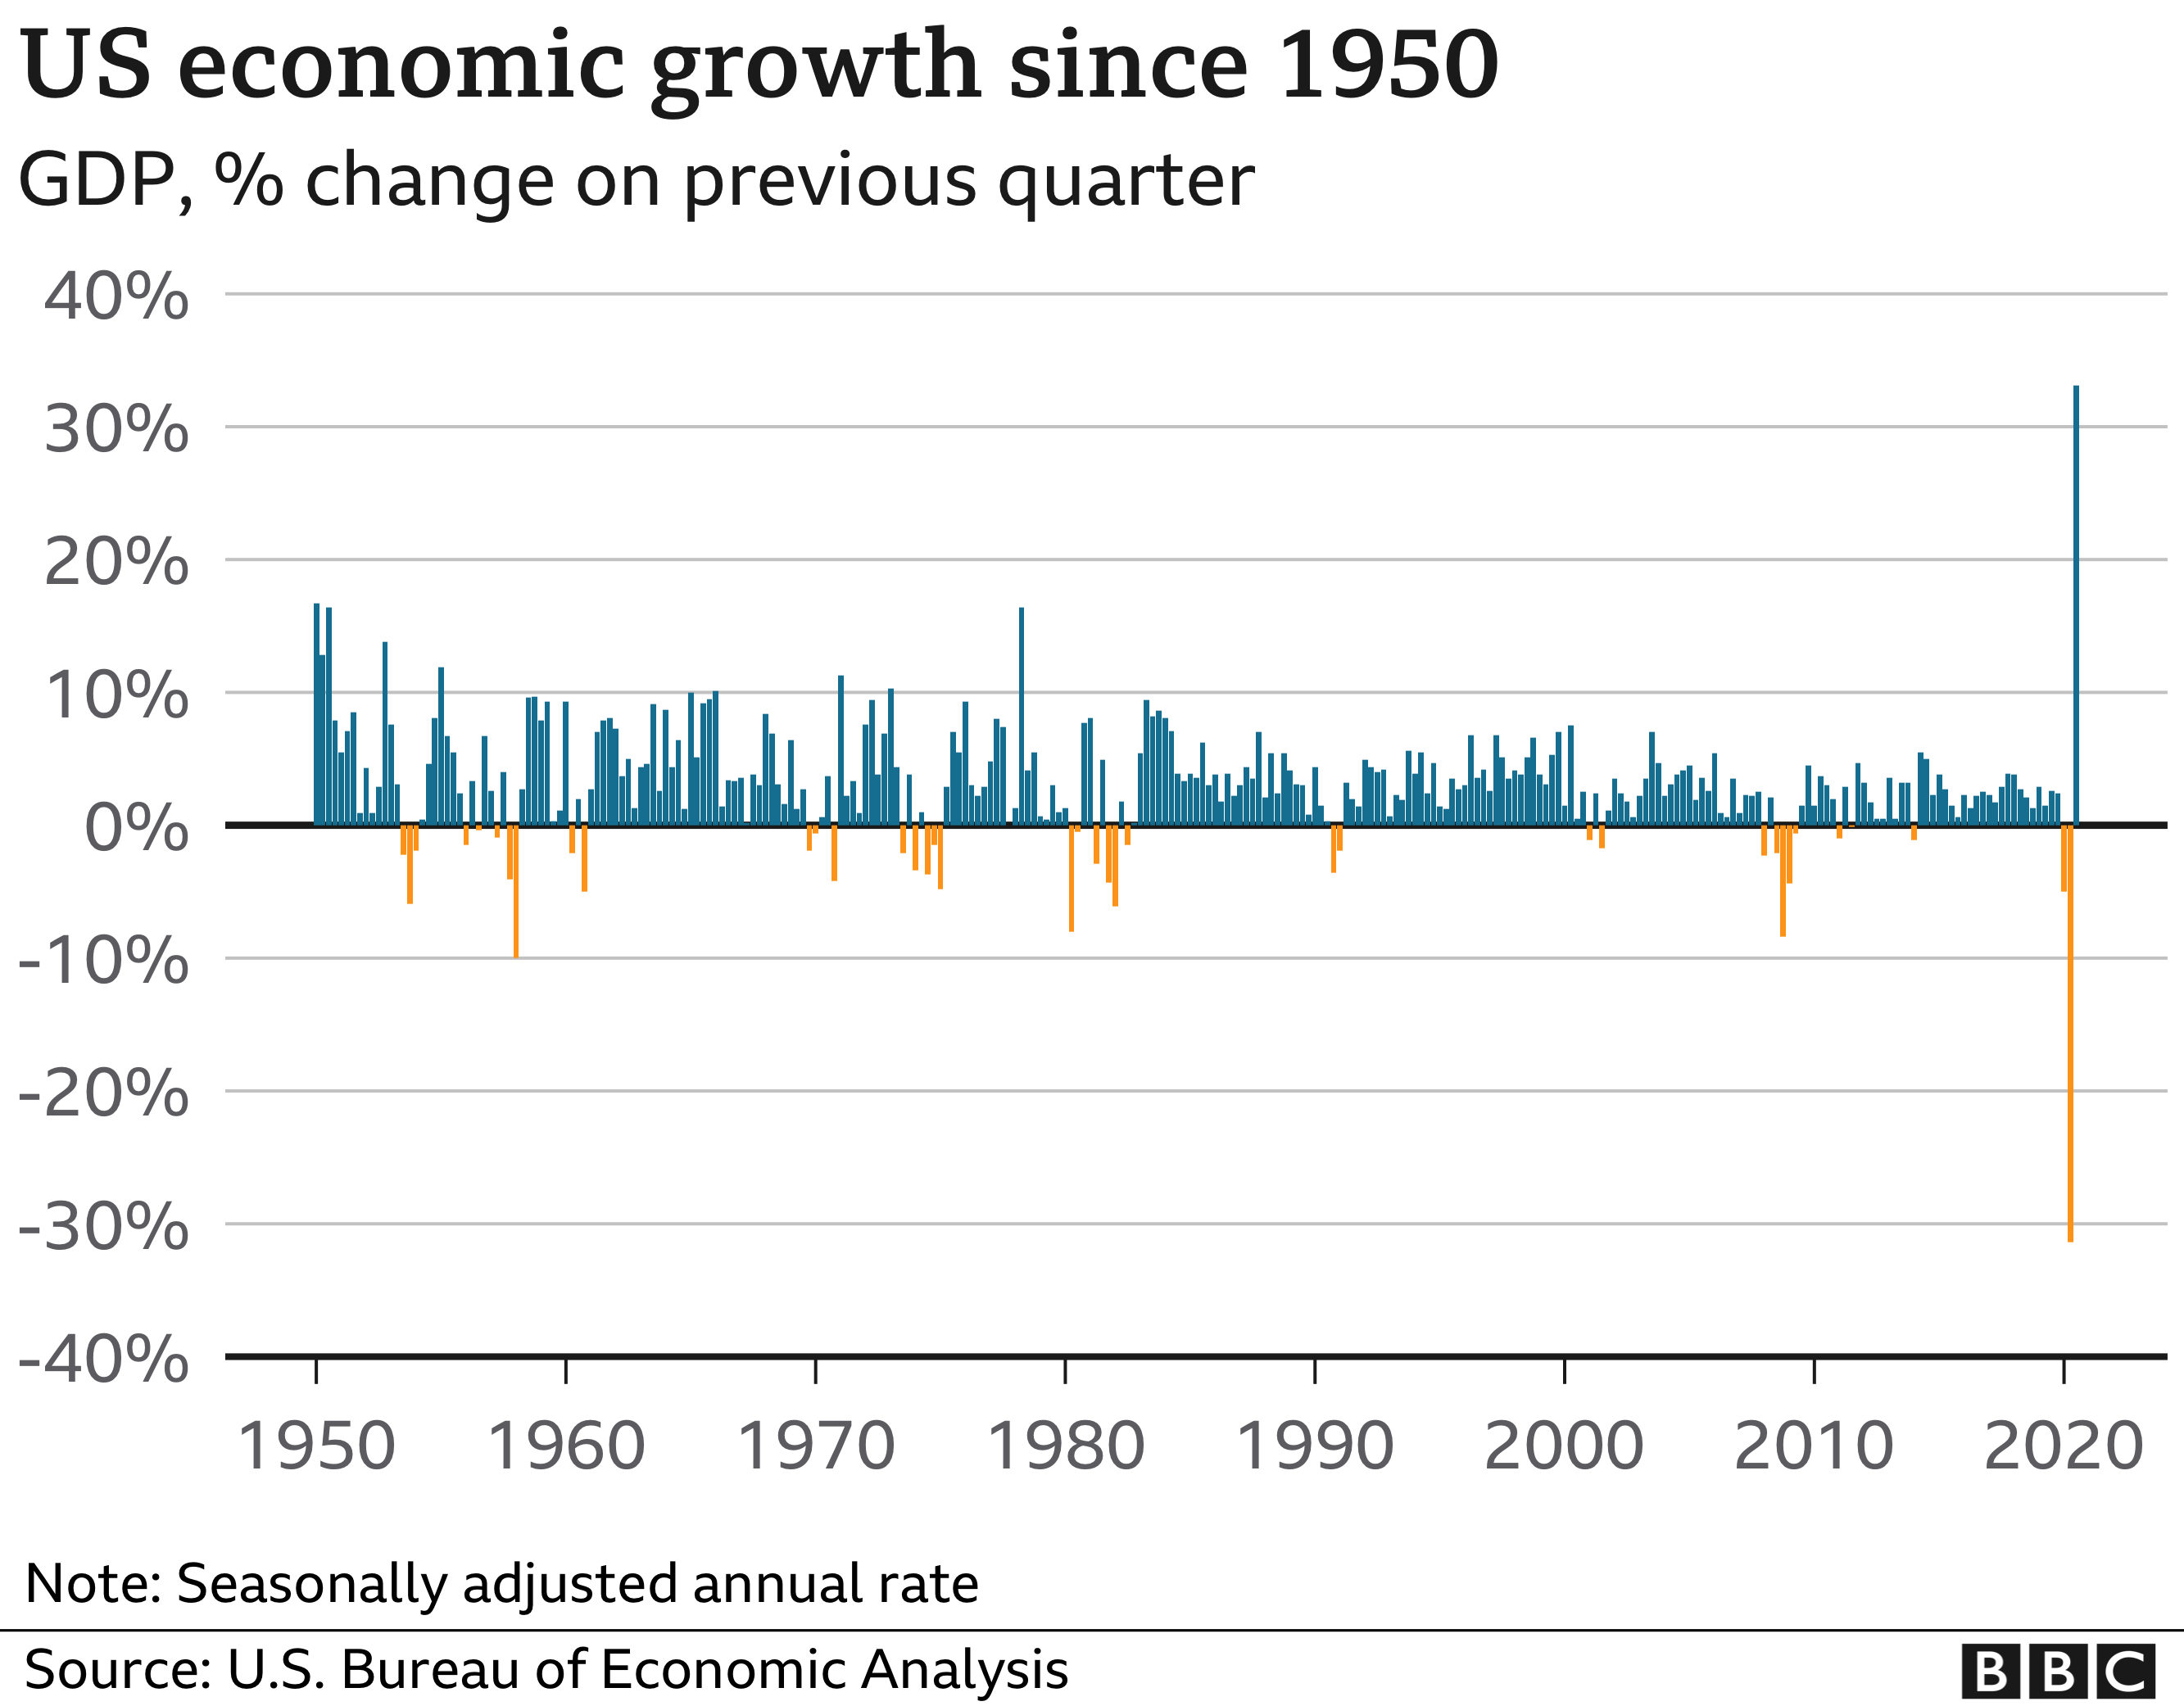 During his first three years in office, President Trump oversaw an annual average growth of 2.5%. The last three years of the Obama administration saw a similar level of growth (2.3%). Prior to the recent post-pandemic fluctuations, if we look at growth rates as far back as comparable records allow, it's clear there have been frequent periods when the growth of GDP - the value of goods and services in the economy - has been significantly higher than under President Trump. In the early 1950s, for example, annualised GDP growth rate periodically exceeded 10%. 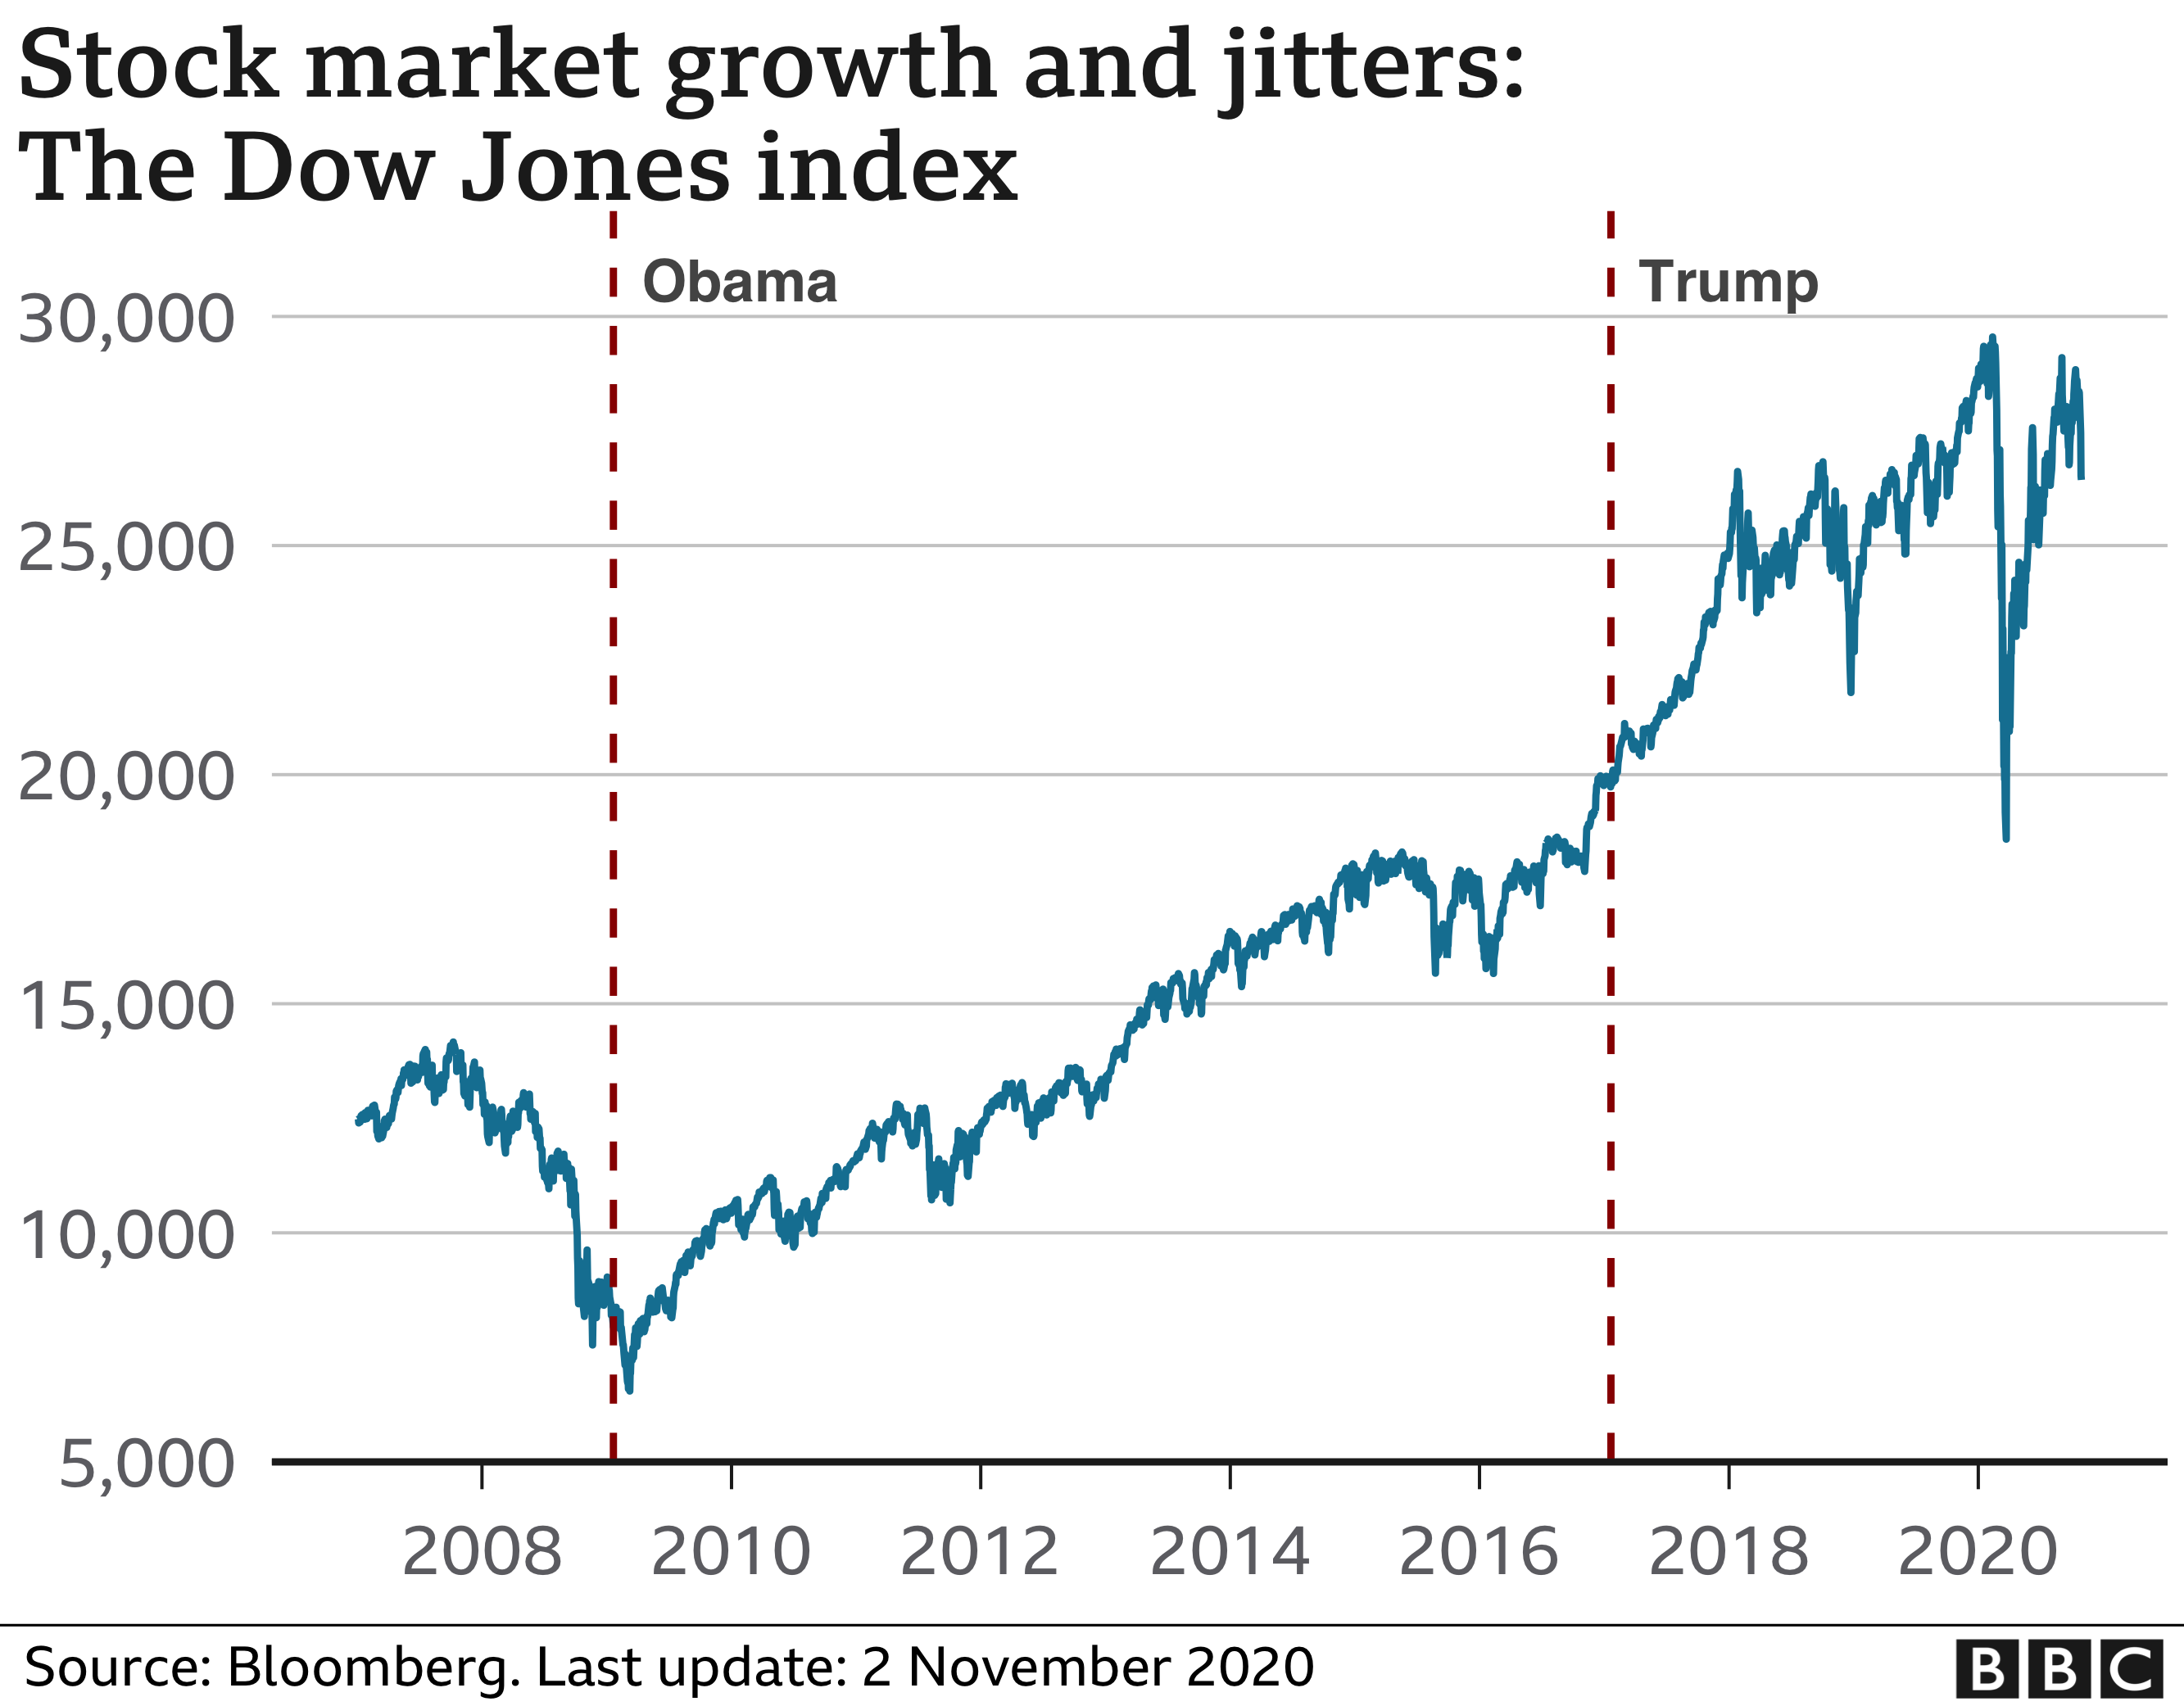 President Trump often highlights the rising value of US financial markets as a measure of success - in particular the Dow Jones Industrial Average. The Dow is a measure of the performance of 30 large companies listed on US stock exchanges, and it reached record highs at the start of this year. It then crashed as markets reacted to the coronavirus pandemic, wiping out all the gains made since President Trump took office. But the financial markets have been remarkably resilient and have largely recovered back to near pre-pandemic levels, although there have been recent wobbles. 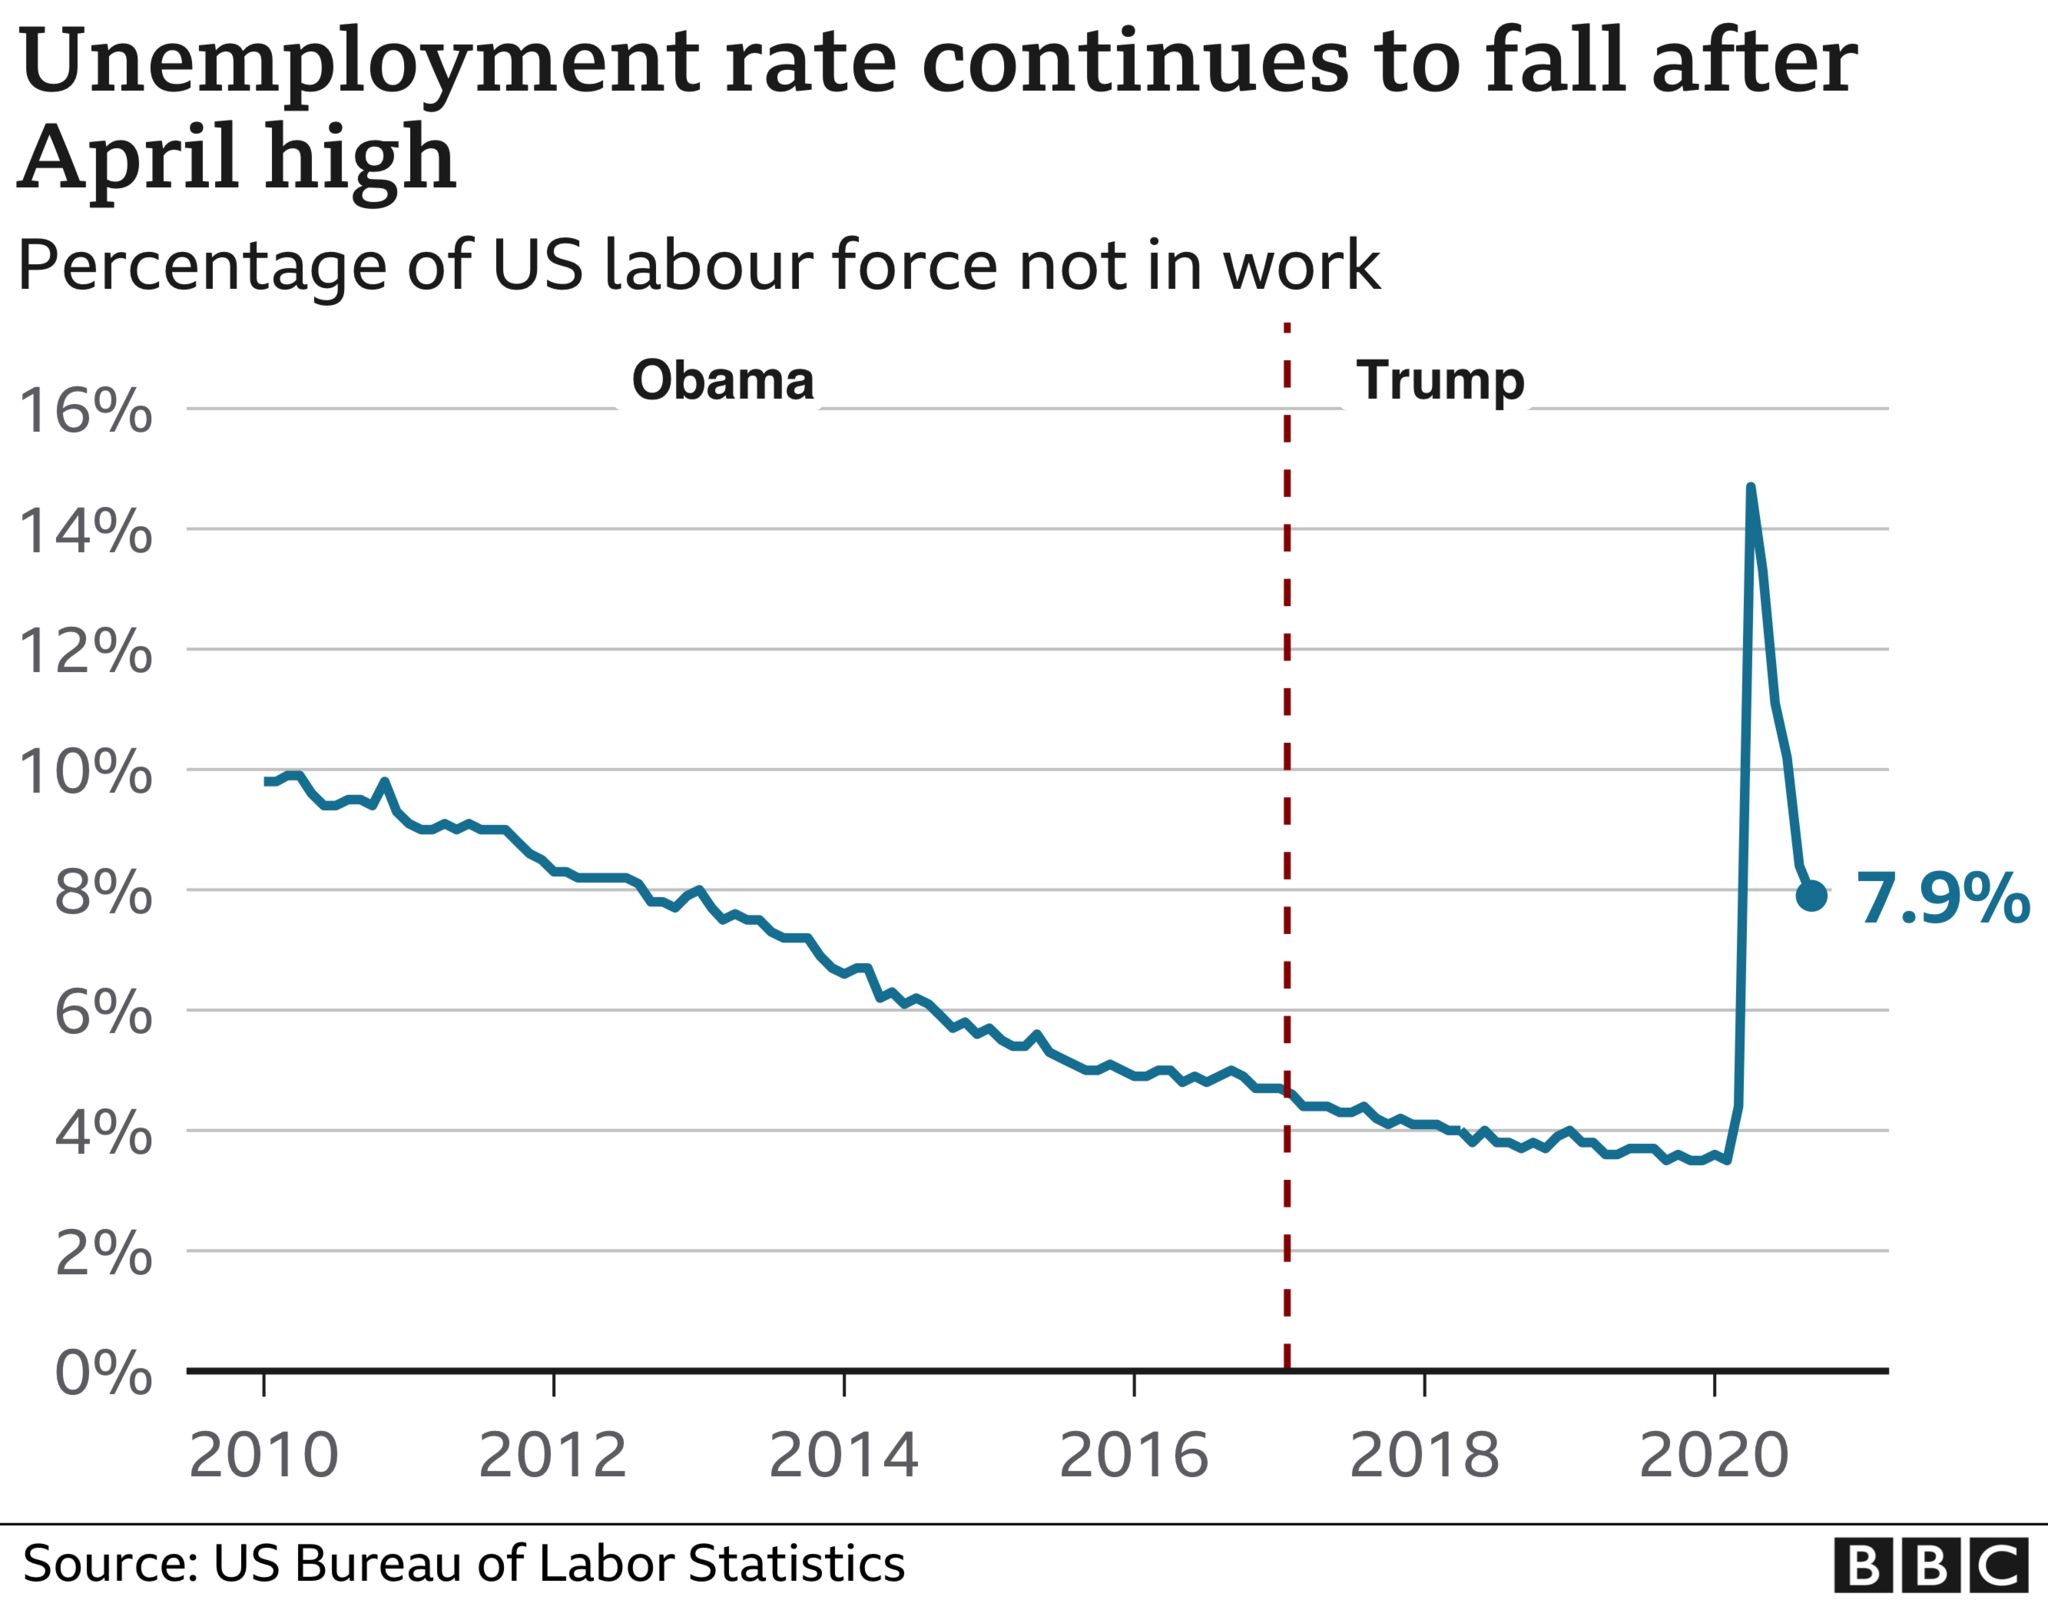 Prior to the pandemic, President Trump claims to have delivered the lowest unemployment rate in half a century. This is true. In February this year, the rate stood at 3.5%, the lowest for more than 50 years. However, the Obama administration added more jobs to the economy, comparing similar time-frames. Under Trump, in the three years prior to the pandemic, there were an additional 6.4 million jobs. In the last three years under Obama, seven million jobs were added. As in many parts of the world, coronavirus lockdown measures very quickly led to soaring levels of unemployment in the US. The rate jumped to 14.7% in April, the highest level since the Great Depression of the 1930s. The US Labor Department says more than 20 million people lost their jobs, eliminating a decade of employment gains in a single month. Since the peak in April, unemployment has fallen back significantly to 7.9% in September. 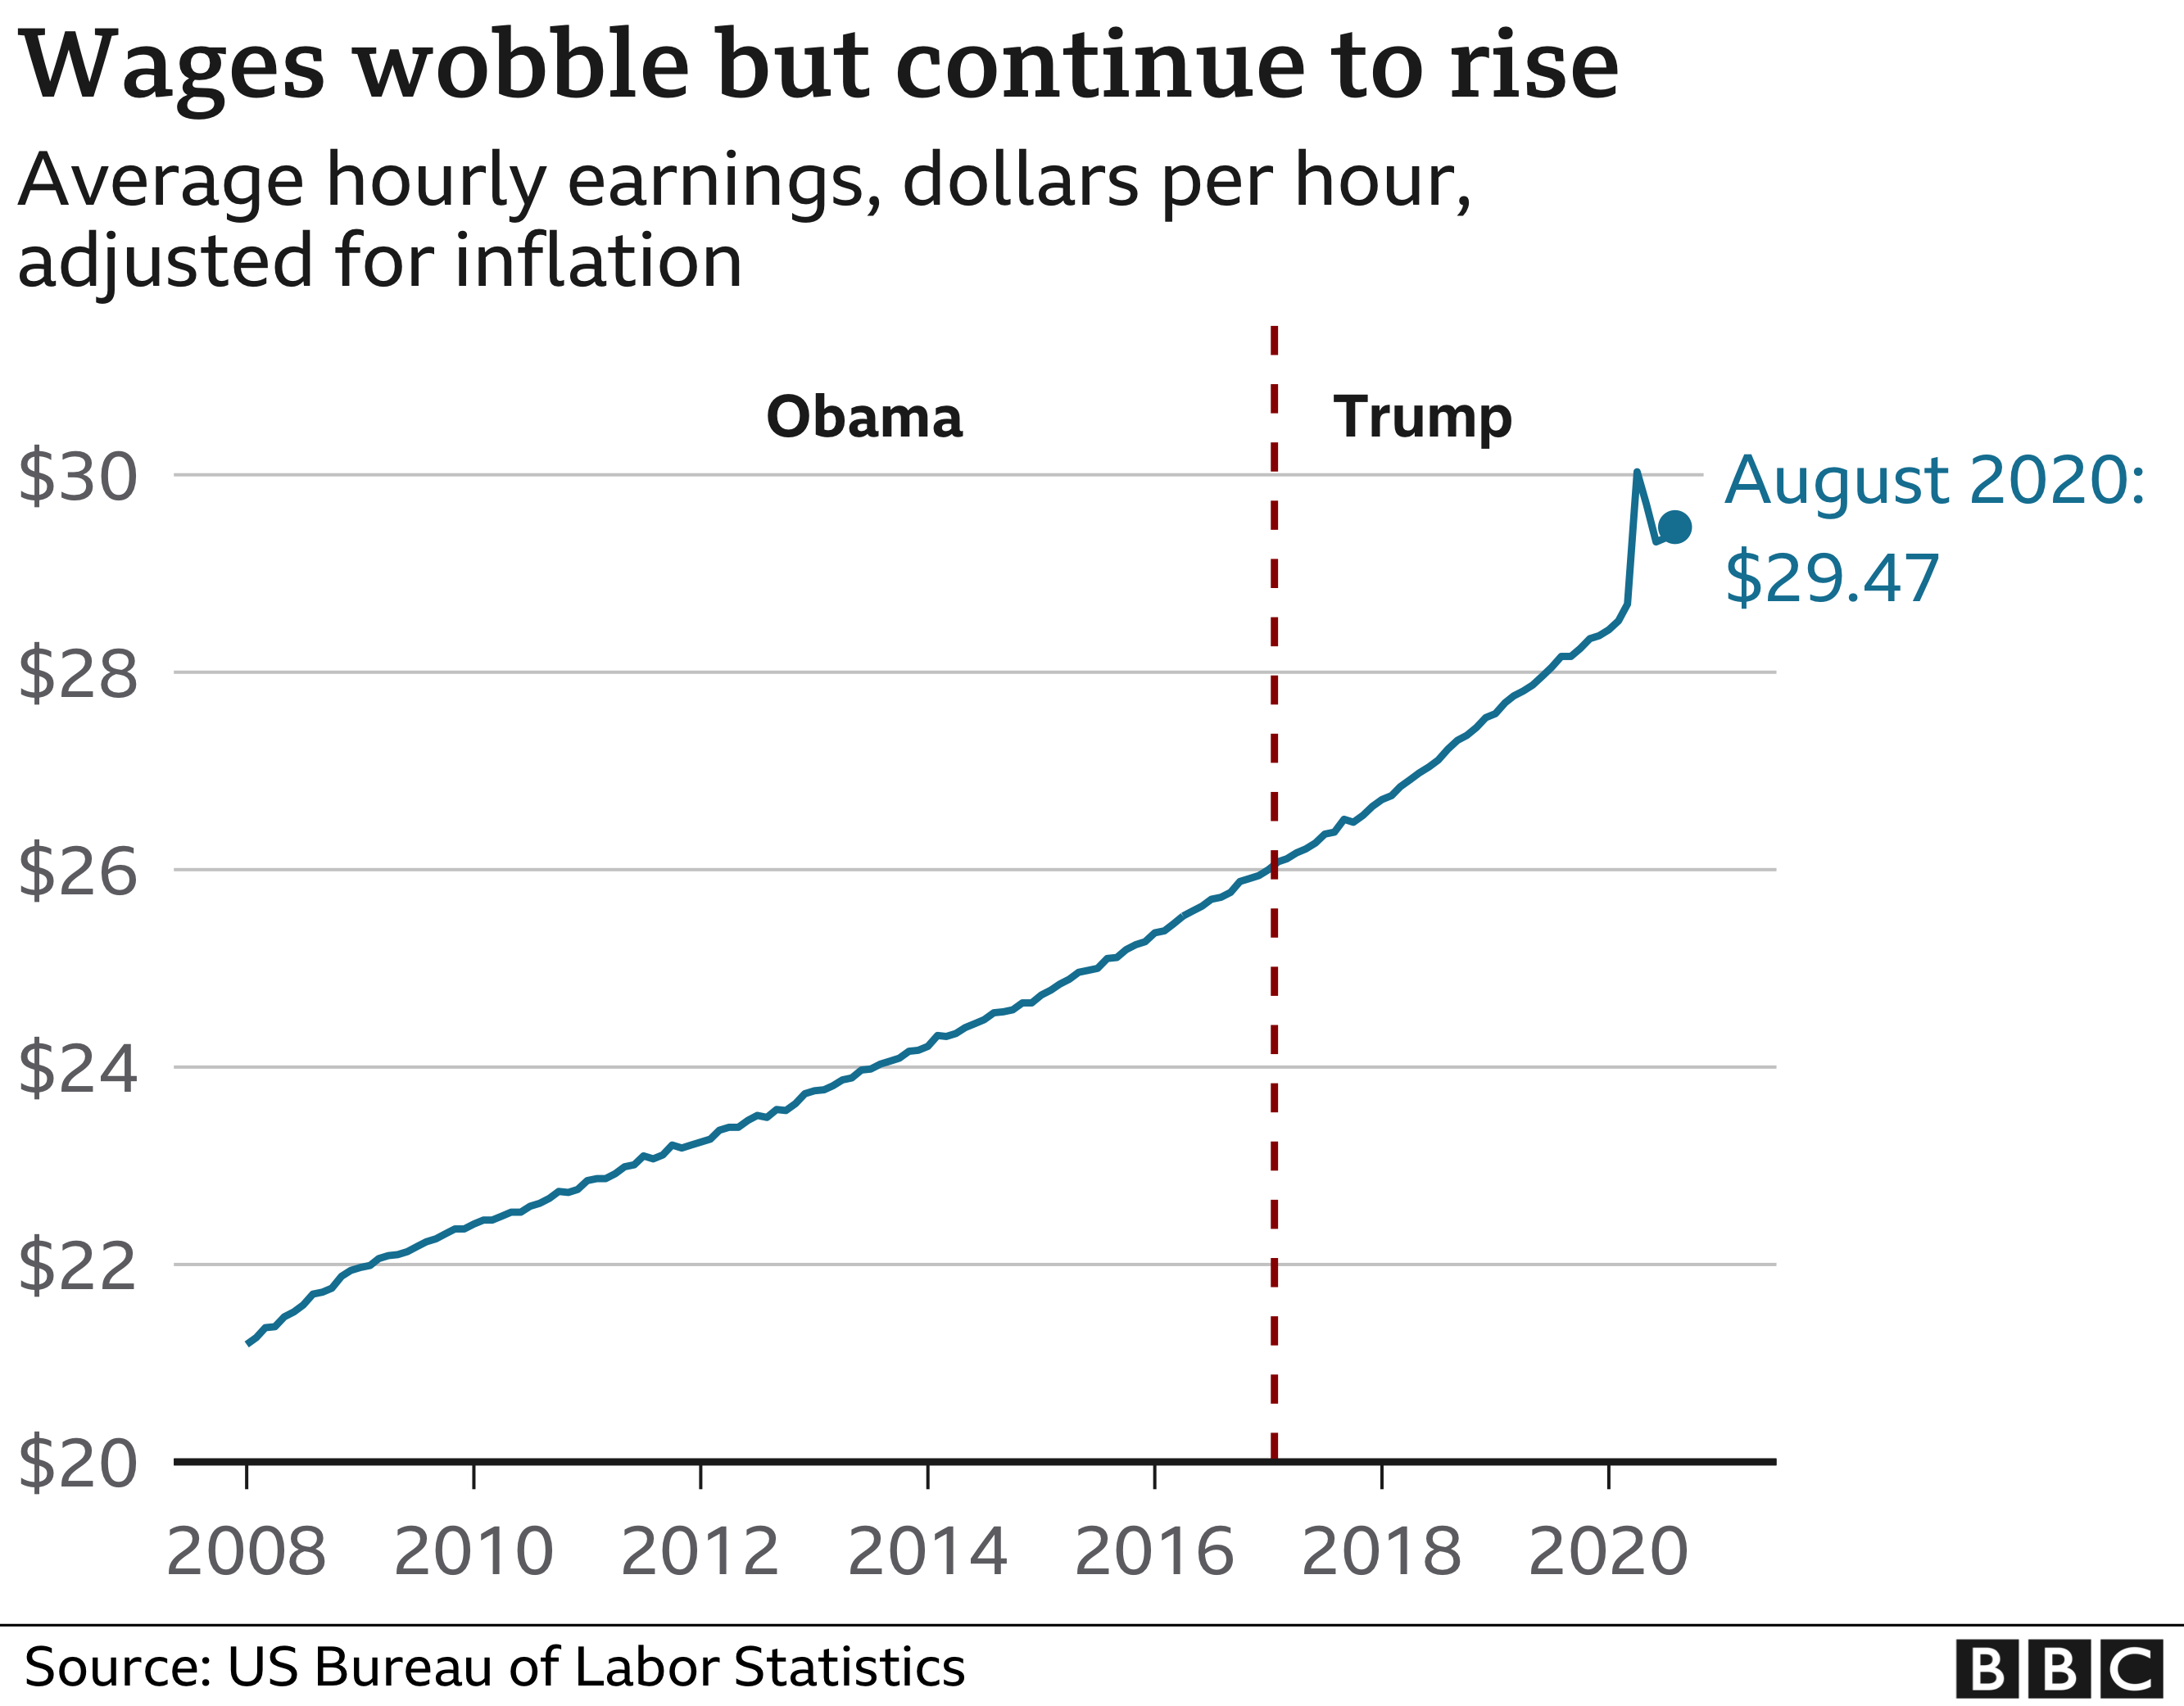 Real wages (adjusted for inflation) grew throughout Trump's first three years in office - continuing a steady upward trend which began during the first of President Obama's two terms. This growth reached 2.1% per annum in February 2019, prior to the pandemic. This is lower than the real wage increases of up to 2.4% that President Obama oversaw in 2015 The rapid increase in average earnings then seen at the start of the coronavirus lockdown were largely as a consequence of the lowest-earning Americans losing their jobs at a disproportionate rate, following the economic downturn. With lower wage-earners out of jobs, the average hourly wage data skewed sharply upwards. Average wages have since started to fall back, as economic restrictions have eased. 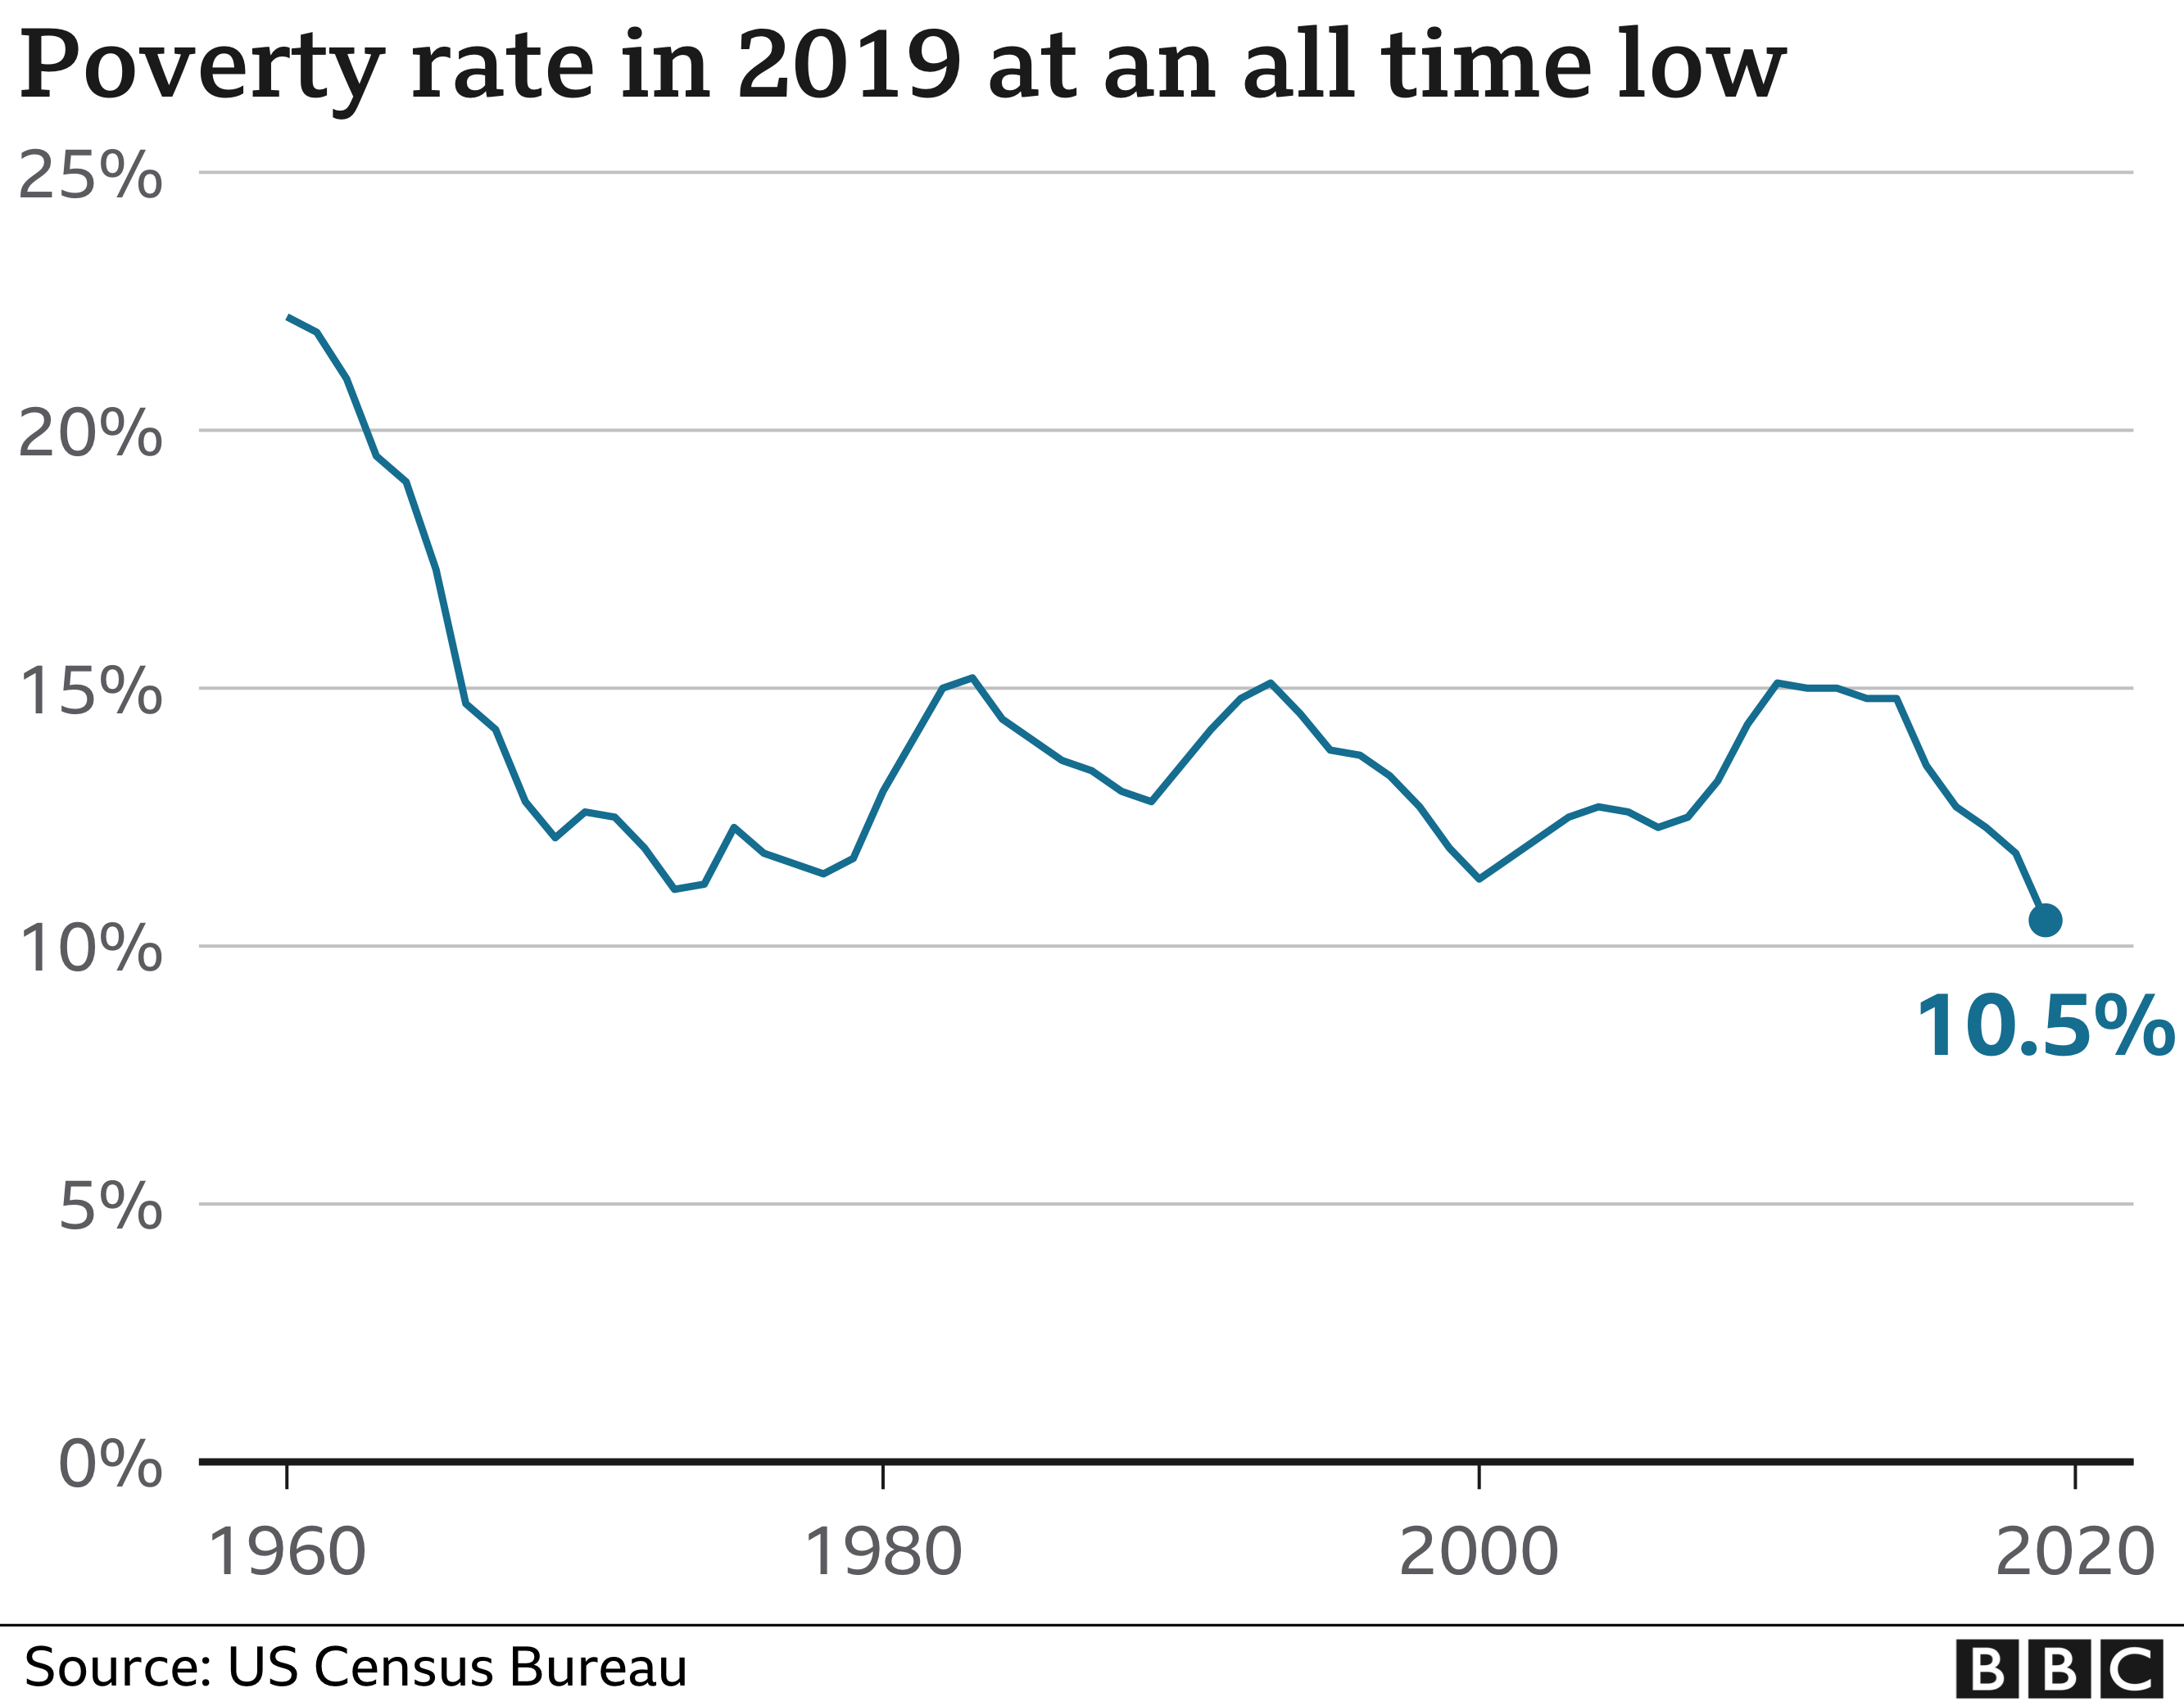 President Trump claimed in 2019 that he had delivered "the largest poverty reduction under any president in history". In 2019, around 4.2 million fewer people were living in poverty in the US compared with the previous year, according to official data. This is a significant drop, but not the largest reduction in history. The US Census Bureau has published this poverty data since the end of the 1950s. The largest fall in a single year was in 1966 during the administration of President Lyndon B Johnson, when almost 4.7 million people were lifted out of poverty. The financial crisis of 2007/8 and subsequent economic downturn saw sharp rises in poverty, which only began to decline from around 2015 during the Obama administration, with a growing economy and rising levels of employment.  IMAGE SOURCE,GETTY IMAGES IMAGE SOURCE,GETTY IMAGESFood banks in the US face continued demand as unemployment due to the pandemic persists.
The continued strength of the economy under President Trump (at least until the pandemic hit) has been matched by a continuing fall in the poverty rate. This overall national figure masks wide variations across regions and ethnic groups in America. In 2019, while 10.5% of the population was defined as living in poverty, the figure for black Americans was 18.8 and for white (non-Hispanic) Americans it was 7.3%. Figures for 2020 are not yet available, but are expected to show a sharp rise in poverty as a result of the pandemic.
|
|
|
Return-To-Index |
| Msg ID: 2712690 |
Crow you should stick with posting about the virus +1/-2
|
| Author:Old Guy
12/4/2021 2:57:03 PM Reply to: 2712686 |
You really do not understand crap do you. First of all who the hell is Reality Check Team?
Looking at the first chart I would say it proves; Obama's economy recover had NO recovery at all. Trumps recovery hit 38%, great recovery. Obama economy was not stable, look at the ups and downs. The Government quantitive easing was required to keep the economy from total failure. Trump chart show stability in growth, no quantitative easing to prop up the economy From the first chart you can see the economy with Trump was stable, growing, even as interest rates went up, and the recovery from the virus was awesome. Not true with Obama. Second chart is very misleading, they had to display all the way back to the 1950 so Obamas years don't look so horrible. This chart shows the lack Of stability during Obama's years even better, and Trumps recovery even more awesome. Third chart is a stock market chart. The stock market is not the economy! It does show the rapid growth under Trump . And that is without the government throwing money at the market. Note the chart is just about % growth, not total money invested. 4th chart, shows very little, it does show the huge gain that Trump had as he handled the virus. The last chart if true (I don't think it is) shows that wages increased under Trump in just Two years, more than wages increased under all the time Obama was president.
I do not even understand why you would post these charts, I don't think they are correct, they are misleading and don't show that Trump did that bad.
|
|
|
Return-To-Index |
| Msg ID: 2712765 |
Open your eyes +2/-0
|
| Author:bladeslap
12/6/2021 9:09:38 AM Reply to: 2712690 |
Crow showed you charts which depict what happeend in Obama's economy and what happened in Trump's economy. Job Growth was the same the last 3 years of Obama and the first 3 years of trump Unemployment kept the same exact trajectory The stock market did better the last 3 years under Obama as it did the first three years under Trump Trump doubled the defecit... Wait, shall I say it again ... TRUMP DOUBLED THE DEFICIT before the pandemic even started...just to try to "maintain" the growth of Obama... Points for Obama: He successfully lowered the deficit every quarter he was in office (Except for one) Unemployment feel every single quarter In his eight years in office, U.S. GDP growth averaged 1.62% under Obama, about 70% higher than Trump’s growth rate. Maybe if Trump took the Pandemic a little more seriously, our economy woudn't have been hit so hard. If we all did masks as soon as the CDC told us to, things could have gotten better a lot quicker - That's on Trump for muzzling them |
|
|
Return-To-Index |
| Msg ID: 2712769 |
Your points are empty and baseless! (NT) +1/-2
|
| Author:Old Guy
12/6/2021 9:18:18 AM Reply to: 2712765 |
|
|
|
Return-To-Index |