|
Msg ID:
2716141 |
Obsy brings up a good point- Taking responsibility +1/-0

|
Author:bladeslap
1/7/2022 4:45:54 PM
|
Obsy,
Please name one thing Trump took responsibilty for (that didn't go as planned) in his entire presidency.
Next, please name something Biden took responsbility for
Thanks |
 |
Return-To-Index
|
|
Msg ID:
2716151 |
Obsy brings up a good point- Taking responsibility +2/-1
|
Author:Old Guy
1/7/2022 7:12:53 PM
Reply to: 2716141
|
With Trump the better question is "what are the things he did that went wrong?
Sure you can produce a list but everything on it will be opinion.
Trump did take responsibility for the goverment shut down over the wall? There as that.
Biden has had major blunders, one after the other, and instead of taking responsibility for the failure he tells us how good he did. The worst In my mind was Afghanistan. Other might consider the inflation or crisis at the border.
Today was a good example, shitty jobs report, but he didn't take responsibility, instead he mislead the facts. |
 |
Return-To-Index
|
|
Msg ID:
2716224 |
With Trump the better question is "what are the things he did that went wr +2/-0
|
Author:TheCrow
1/8/2022 1:09:35 PM
Reply to: 2716151
|
"With Trump the better question is "what are the things he did that went wrong? "Sure you can produce a list but everything on it will be opinion." One can argue most of Trump administration actions, one way or the other. Until the novel coronavirus. His minimizing the risk, denying and delaying rational public health measures clearly caused the 2020 economic contraction and hundreds of thousands of deaths. The Donald has rationalized, explained that failure as an attempt to avoid panic. Is this better? United States Coronavirus Cases: 60,464,426; Deaths: 858,346 The estimated death toll in America is 970,243 reported COVID-19 deaths based on Current projection scenario by April 1, 2022. That estimate is based on the number of infections peaking in late January or into February 2022. If, as many experts believe, the Covid-19 pandemic continues in America, there will be reduced rate of fatalities after April, but many more Americans will die. There is a reason why America, with state of the art healthcare resources, has a disproportionate number of infections compared to other advanced economies- Trump's delay allowed the novel coronavirus enough time to establish itself. America has had the highest number of infections from that day forward. Even The Donald, a sitting president, was infected and hospitalized with Covid-19. Ironic, isn't it? |
 |
Return-To-Index
|
|
Msg ID:
2716238 |
Really +1/-1
|
Author:Old Guy
1/8/2022 3:01:02 PM
Reply to: 2716224
|
I did post it would be better to post what Trump did that went wrong. You did not identify anything.
That is just opinion. Maybe the telling point is, which persident has had more deaths.
Which president has had more death from Covid during his watch? |
 |
Return-To-Index
|
|
Msg ID:
2716257 |
"Really" We can argue about many of the Trump administrations actions. +1/-0
|
Author:TheCrow
1/8/2022 5:27:55 PM
Reply to: 2716238
|
"I did post it would be better to post what Trump did that went wrong. You did not identify anything."
We can argue about many of the Trump administrations actions. Trump well and truly screwed the pooch withe the novel coronavirus. He denied, minimized and delayed response to the novel coronavirus for at least three months, allowing the 15 infected to become thousands.
"Which president has had more death from Covid during his watch?"
A point that has no point. How long does it take for an epidemic to become uncontrollable? 1 infection? 15? Those are numbers that can be quarantined, contact traced.
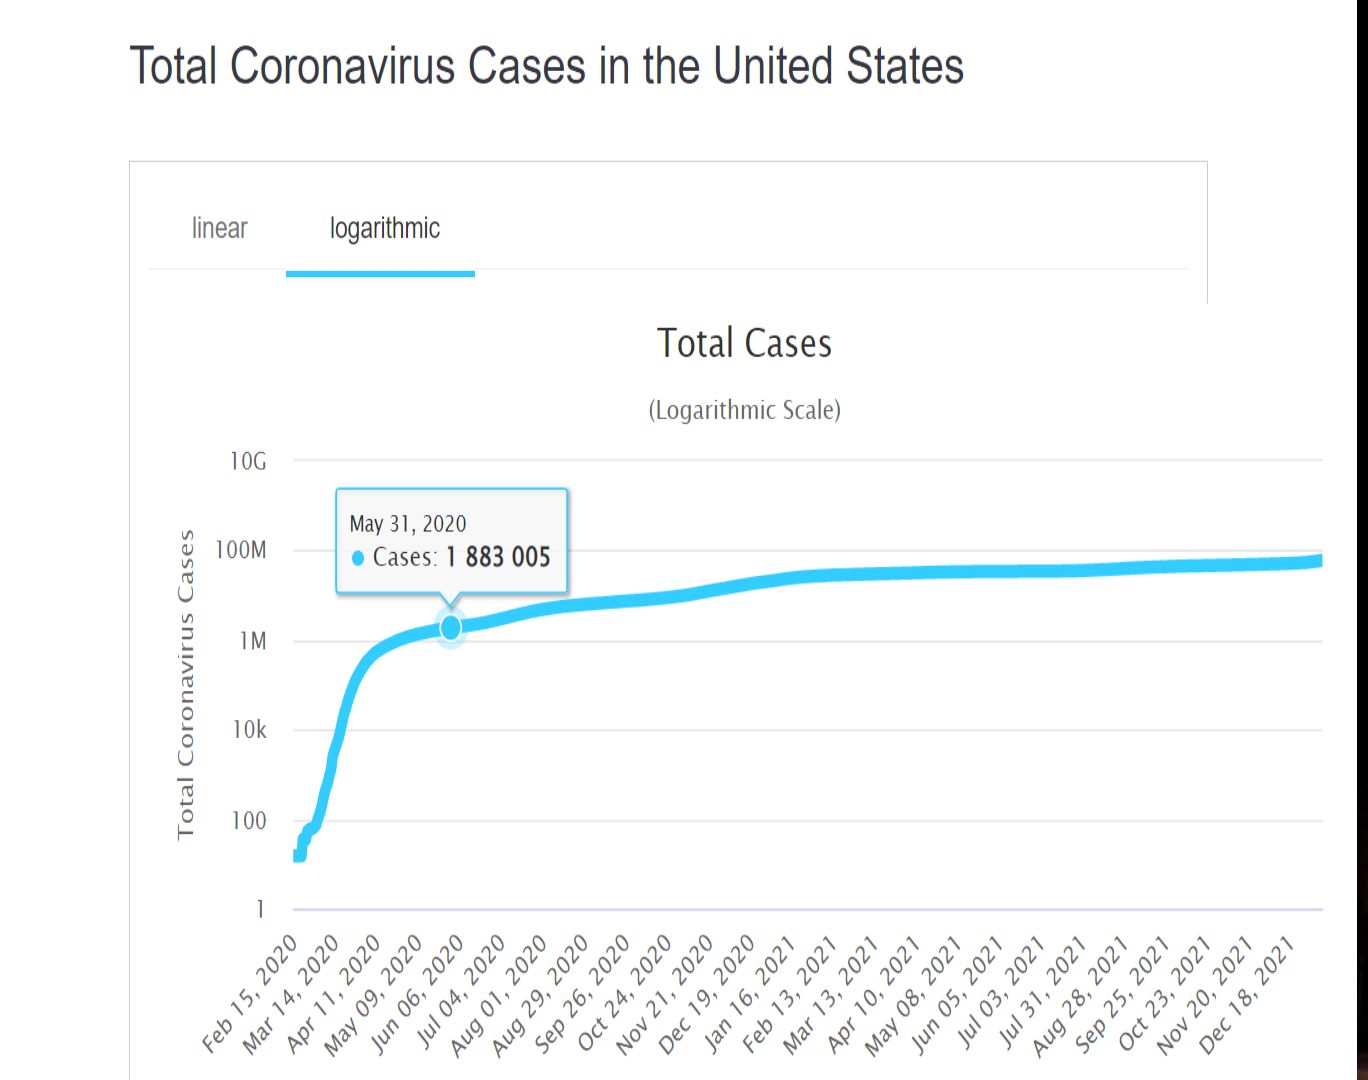
America, on March 3 2020 had 124 cases; that's a number that can be addressed by public health measures.
In June 2020, America had 1,901,523 Covid-19 cases.
This is why prompt public health measures are important. Watch how quickly the number of infected increase from February to June. Trump's minimization, delay and denial killed hundreds of thousands more Americans:


|
 |
Return-To-Index
|
|
Msg ID:
2716251 |
With Trump the better question is "what are the things he did that went wr +2/-0
|
Author:bladeslap
1/8/2022 4:43:04 PM
Reply to: 2716224
|
"I purposely downplayed Covid - The Chineese flu" ... It's no worse than the flu. It will just magically go away. The democrats and the news are making more an issue out of it than it needs to be.
More than 1 in every 500 people in the country died of it
More than 1 in 100 over 65 died from it
What Share of People Who Have Died of COVID-19 Are 65 and Older – and How Does It Vary By State? | KFF
|
|
Return-To-Index
|
|
Msg ID:
2716227 |
Biden has had major blunders, one after the other, and instead of taking +0/-0
|
Author:TheCrow
1/8/2022 1:33:11 PM
Reply to: 2716151
|
"Biden has had major blunders, one after the other, and instead of taking responsibility for the failure he tells us how good he did. The worst In my mind was Afghanistan. Other might consider the inflation or crisis at the border."
One of the surest indicators of a weak position in an argument is false equivalency. Biden isn't operating in the same world situation as Trump was. They each have made significant errors. I agree that the AFghanistan withdrawal was- to put as good a face on it as possible, was apparently a horrendously flawed exercise that killed as almost many Americans in it's execution as the average annual toll.
Could that have been done better, with less Americans killed and injured? Probably, but that's 20/20 hindsight. What is absolutely undeniable is that Biden took Americans out of Afghanistan, minimizing further fatalities after that point. Trump didn't do that, or couldn't take the risk that Biden did. Neither could Obama and W Bush. But Biden got it done, period.
The current inflationary economics has clearly identifiable, temporary causes. Those causes were also unavoidable as the world economies started recovering from the Covid recession.
There are external causes of the border crisis that no president can control. Biden has made mistakes in his handling of the issue. The question is how much more tax burden are Americans willing to bear to minimize 'undocumented' immigration? How much is it costing Americans now?
(excerpt)
Abstract
"This article examines the major economic pros and cons of illegal immigration and answers the question: what, if any, are the public and private costs of illegal immigration in the United States? In brief, the article finds that between four and 5.4 million illegal immigrants reside here.... The article also finds that illegal immigrants and their own citizen children cost taxpayers an additional $12 to $16.2 billion annually for education, public services, and incarceration after deducting all local, state, and federal taxes paid in by them. In the private sector, illegal aliens are found to save their employers and owners of capital about $1.5 billion more than U.S. workers lose due to wage depression. The article also considers what legal and enforcement reforms would be necessary to dramatically slow the current flow of 300,000 illegals yearly and concludes that, although improvements in the system are now being proposed, the actual reforms will be insufficient to more than stem the currently rising tide of illegals due to economic instability in Mexico and the Third World."
|
|
Return-To-Index
|
|
Msg ID:
2716240 |
Really +1/-1
|
Author:Old Guy
1/8/2022 3:10:04 PM
Reply to: 2716227
|
You are posting from a very weak position, none of what you claim is true. Most of it has been debated over and over. You points have never been proven to be true. |
|
Return-To-Index
|
|
Msg ID:
2716242 |
Crow!what the crap? +1/-1
|
Author:Old Guy
1/8/2022 3:18:02 PM
Reply to: 2716227
|
Was that article that you linked and base your point of view on, really written in April 1995? |
|
Return-To-Index
|
|
Msg ID:
2716254 |
Unless your last name is +1/-0
|
Author:TheCrow
1/8/2022 4:59:40 PM
Reply to: 2716242
|
"Was that article that you linked and base your point of view on, really written in April 1995?"
Argue the points in the article. You can't. You wish to close the door after you or your immigrant ancestor came here. And all the new world is peopled by immigrants, even the aboriginals were migrant peoples.
America is a nation of immigrants. Immigration is vital to America's continued success. People who have the sufficient ambition to leave their homes are a positive gain for America.
Excerpts from articles discussing the issue:
At the very heart of the American idea is the notion that, unlike in other places, we can start from nothing and through hard work have everything. That nothing we can imagine is beyond our reach. That we will pull up stakes, go anywhere, do anything to make our dreams come true. But what if that’s just a myth? What if the truth is something very different? What if we are…stuck?
The 2020 census shows that America isn’t full — and that it needs immigrants.
The results of the 2020 census are a warning sign that America is on a course for slow population growth.
Economists broadly agree that population growth fuels economic growth in wealthy countries. But the recently released census figures show the US population was 331.5 million people, an increase of just 7.4 percent between 2010 and 2020 — the lowest rate since the 1930s. Projections suggest that, unless current trends change, those numbers could continue to diminish dramatically over the next two to three decades, with the population growing by just 78 million by 2060.
American birth rates are low, and that’s a problem. There are two ways to increase the population: incentivize childbirth or incentivize immigration. While it’s beneficial that the new Covid-19 stimulus will include guaranteed income for parents via the child tax credit, the birth rate is not going to reach the replacement level (the number of births per woman that will sustain the population at its current level) overnight. Even if it did, it will be over two decades before babies born today reach their full economic potential. Immigration, on the other hand, invites workers who are already in their productive primes. They can enter the labor force immediately and start paying taxes, buying products, and supporting the aging population. Importantly, easier and faster immigration can improve the disastrous human rights situation on the American southern border, including the squalid refugee camps full of would-be American workers who are being denied legal access into the country. In short, immigration is a positive-sum game: native-born Americans and immigrants both benefit.
July 21, 2021
By Robert Leonard and Matt Russell
Mr. Leonard is the author of “Deep Midwest: Midwestern Explorations.” Mr. Russell is a co-owner of Coyote Run Farm.
KNOXVILLE, Iowa — Rural America has a growth problem. Business and industry desperately need workers, but the domestic labor pool is shallow, and the nation’s birthrate is slowing.
There’s no better place to help expand our economy than in rural communities like ours. We need smart public policy for sustained growth — and immigration reform would be a big part of it.
The Iowa Business Council, a group made up of representatives of the largest corporations in the state, has been asking for immigration reform for years to help solve our labor woes.
Plenty of research shows that flexible visa programs run federally or by the states could address this problem quickly.
March 12, 2019 1:09 PM EDT
div>
|
|
Return-To-Index
|
|
Msg ID:
2716393 |
"The real cost" versus the real economic benefit. +0/-0
|
Author:TheCrow
1/10/2022 12:40:39 PM
Reply to: 2716260
|
I'm not going to argue the numbers at your posted site. I will point out that, almost item to item, the "most expensive illegal immigrant states' are the most productive gdp economic states. There are factors working in those states that do not operate at the bottom of the productivity states.
People move to those states to participate in the economic activity? Or to avoid the stagnation of the lesser active gdp states? From personal observation, I'll estimate the my home state, Georgia is high on the lists of economic activity because we have a diverse population in the economy. Little Mexico, Little Honduras,Little China, Little india/Begali neighborhoods.
When I have the time, I like to go to one of our international markets in Decatur, Buford Highway. You can buy almost any food-stuff you can imagine at those stores amidst peoples from everywhere. |
 |
Return-To-Index
|
|
Msg ID:
2716262 |
And the crime rate +1/-1
|
Author:Old Guy
1/8/2022 5:43:39 PM
Reply to: 2716254
|
Notice the huge jump in crimes from illegals once Biden took office.
I https://www.cbp.gov/newsroom/stats/cbp-enforcement-statistics/criminal-noncitizen-statistics |
 |
Return-To-Index
|
|
Msg ID:
2716396 |
US crime: Is America seeing a surge in violence? +0/-0
|
Author:TheCrow
1/10/2022 12:46:53 PM
Reply to: 2716262
|
No.
By Jake Horton
BBC Reality Check
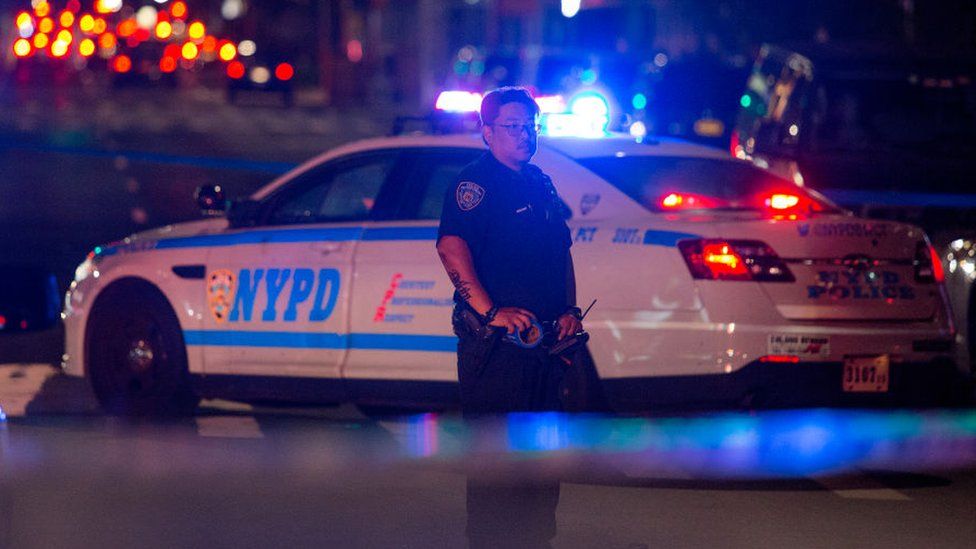
Image caption,
Police in Brooklyn investigate the scene of a shooting
New York has become the first state in the US to declare an emergency to tackle increasing levels of gun violence, directing extra funds for programmes aimed at preventing shootings.
"More people are now dying from gun violence and crime than [from] Covid," state governor Andrew Cuomo said.
President Joe Biden has also promised renewed efforts to tackle crime in the US, as a series of major cities experience spikes in violent offences.
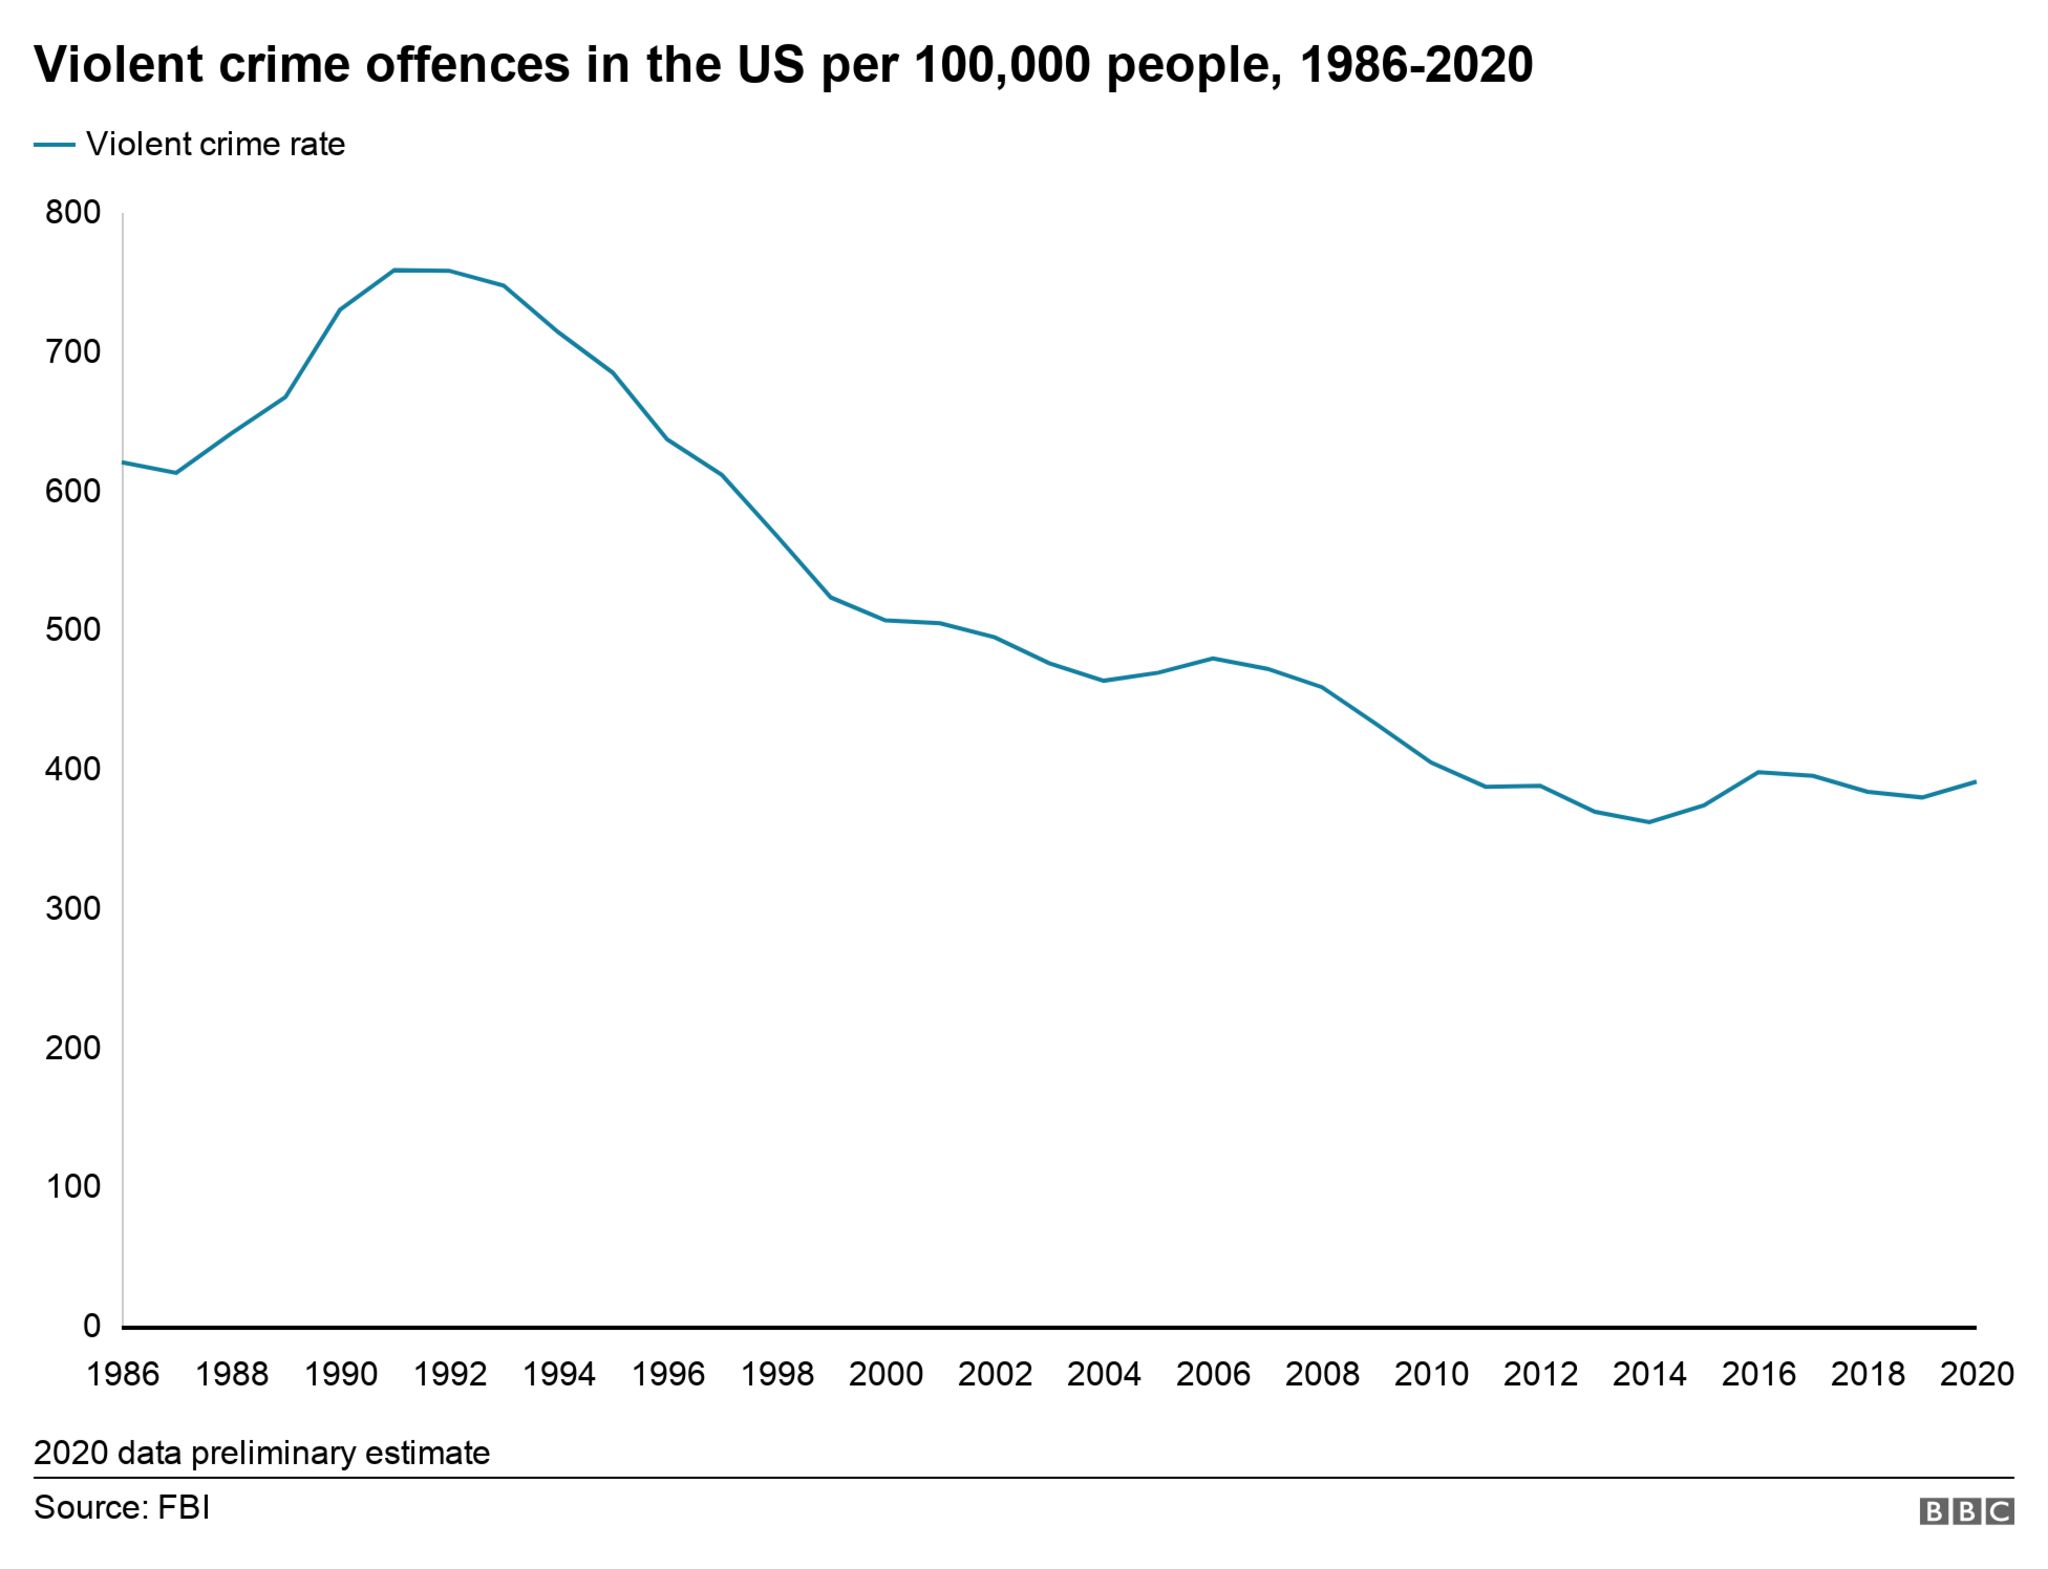
We've taken a look at the violent crime trends across the US.
Is violent crime going up?
Police departments across the US define violent crime in slightly different ways, but the data usually includes murder, robbery, assault and rape.
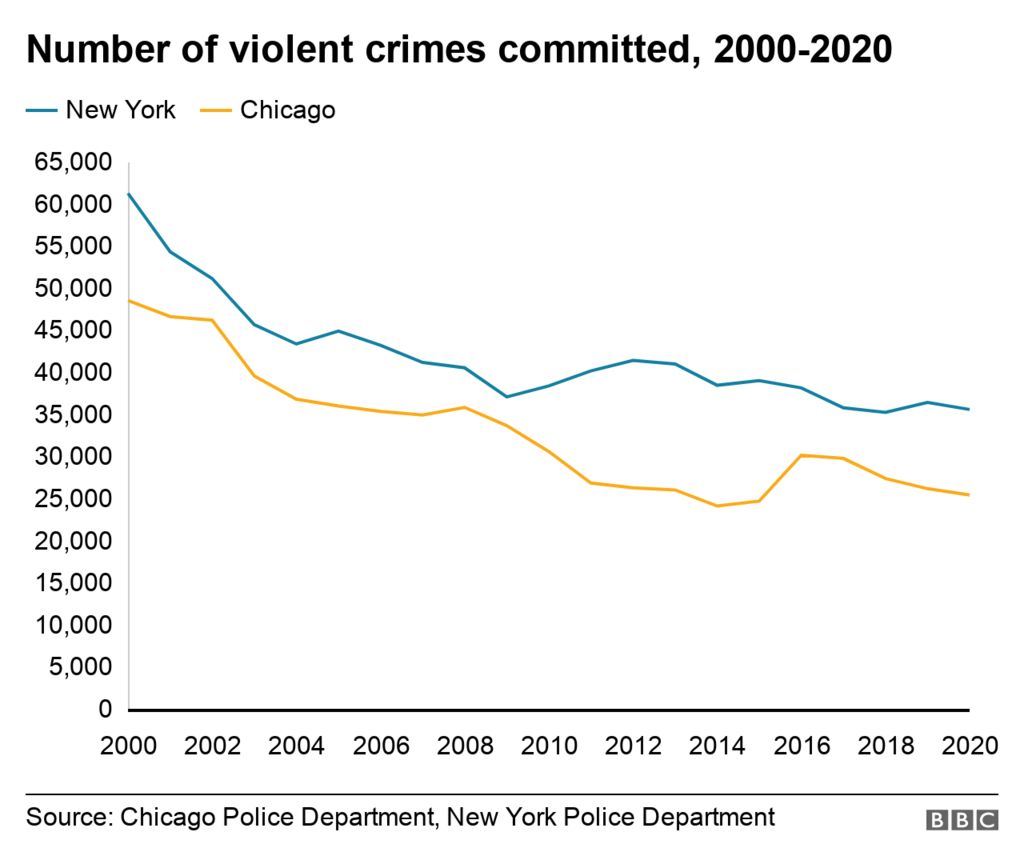
Overall, violent crime was up by about 3% in 2020 over the previous year, but this should be seen in the context of the longer term downward trend from a peak in the early 1990s.
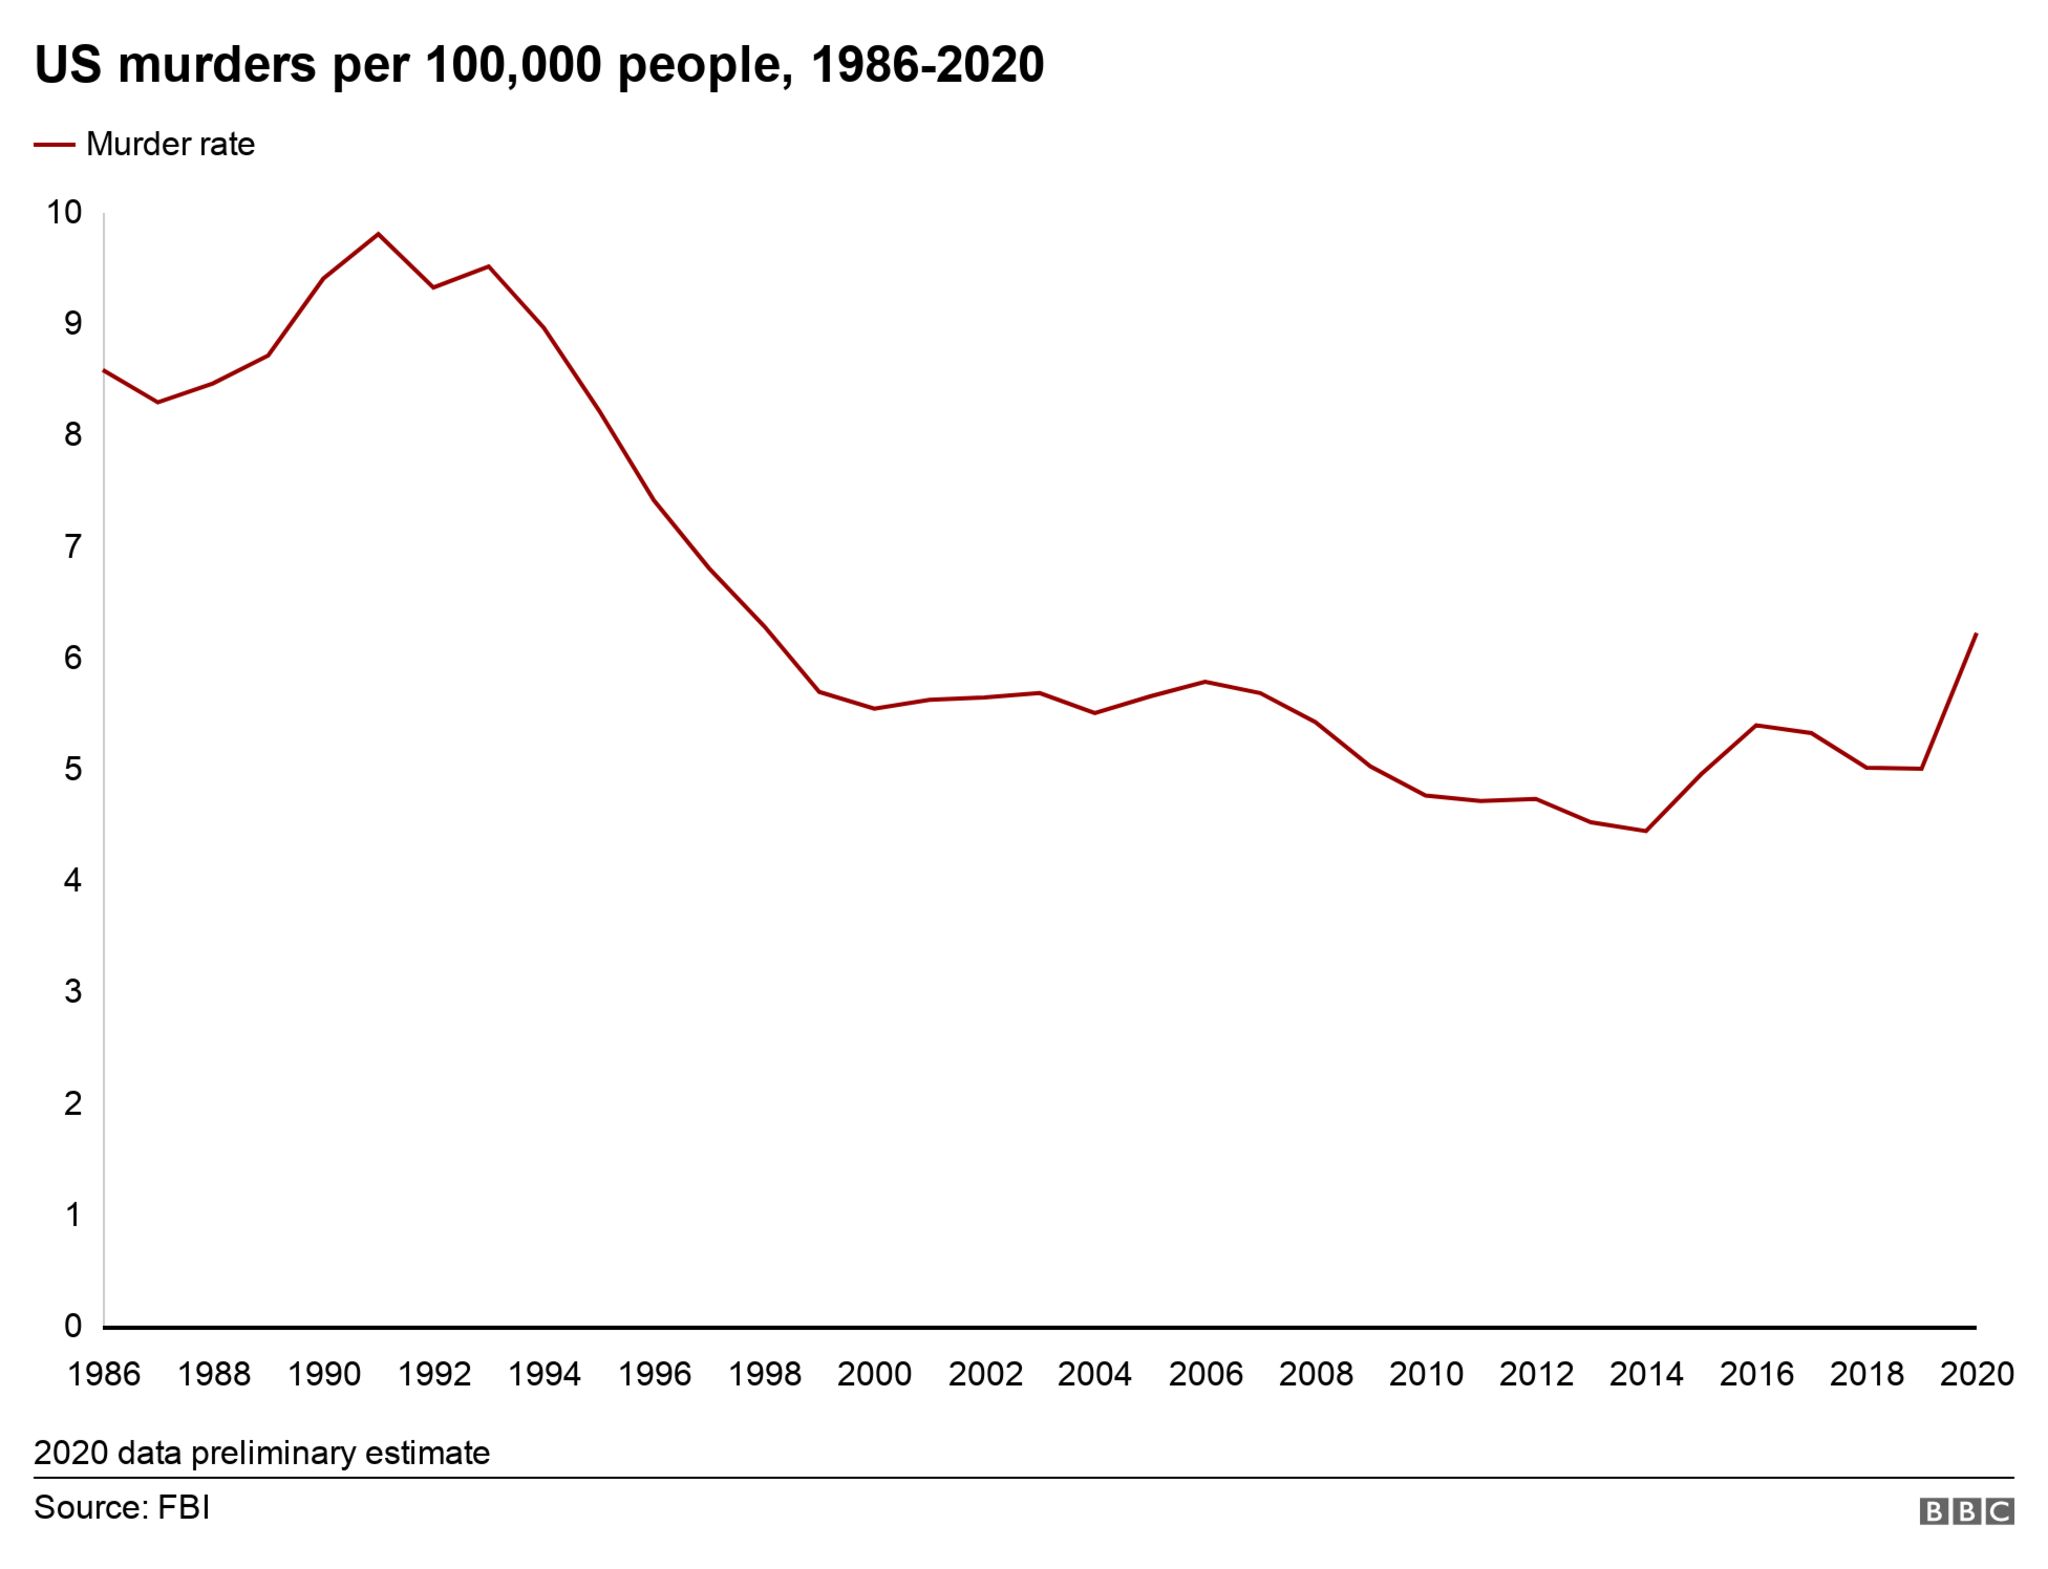
Across the US, there were 25% more murders recorded in 2020 than the previous year.
This is a steep rise, but the murder rate is still far lower than than in the early 1990s, when it was almost double the current figure.
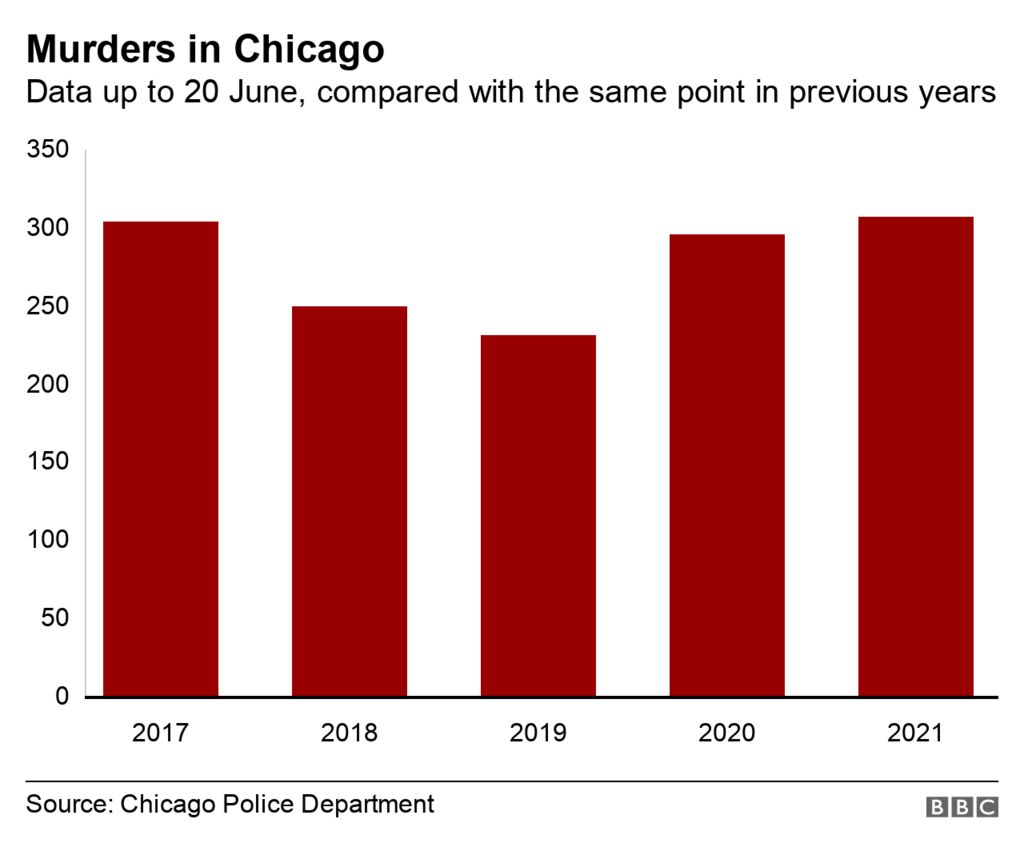
Which cities are seeing a spike in murders?
Major US cities have tended to follow the national trend in becoming safer since the 1990s, but some have also seen a sharp rise in murders recently.
These spikes in some of the biggest US cities have been of considerable concern to President Biden's administration.
The New York Times looked at 37 cities across the US with data for the first three months of this year, and overall there has been an an 18% increase in murders compared with the same time period in 2020.
Chicago has one of the worst records for murders, with a big increase in 2020 and a continuing upwards trend so far in 2021.
Shooting incidents in Chicago are also up 15% on the same point last year, and are more than double the level they were at two years ago.
A rise in the number of shootings has been seen in many other major US cities as well, with President Biden attempting to strengthen firearm regulations to combat gun violence.
New York has also seen shooting incidents and murders rise, continuing an upward trend which began in 2020.
Through to the middle of June, there have been almost 200 murders in New York so far this year - more than a 13% increase on the same period two years ago.
Shooting incidents in New York were up by nearly 38% for the period from the beginning of January up to 4 July compared with the same period in 2020.
However, June this year actually saw fewer shootings than June last year, going by police department data.
It's worth pointing out that over the last 20 years, both New York and Chicago, along with most other US cities, have seen overall violent crime drop significantly.
But in the last 15 months, coronavirus restrictions have put unprecedented social and economic pressures on people.
New York State Governor Andrew Cuomo has linked the upward trend in gun violence to the disruption to school and work life caused by the pandemic.
He said this had left "at-risk youth without safe, productive places to go during the day."
There was also an increase in gun sales during the pandemic, which may have contributed to rising gun violence
|
|
Return-To-Index
|
|
Msg ID:
2716267 |
Crow here is a question for ya! +1/-1
|
Author:Old Guy
1/8/2022 6:14:23 PM
Reply to: 2716254
|
I believe you view illegal immigration the same as an legal immigration. Big difference! We do not object to immigant that comes here by complying with the rules. They get researched, just like immigration at Ellis island did for years! You do know they rejected people that came to Ellis Island. Why do you think they let them get off the ship onto the island and not the main land?
But, illegals are wrong, if the are the same then,
Why do the make up 11% of the inmate population, yet they are less than 4% of the population?
Easy one for you to answer! |
|
Return-To-Index
|
|
Msg ID:
2716388 |
And an answer for ya! +0/-0
|
Author:TheCrow
1/10/2022 12:16:58 PM
Reply to: 2716267
|
I'll cut to the chase for you:
<div class="long-form__wrapper container--medium-down">
About 88.1 percent of all prisoners are men, whereas only 11.9 percent are women (Table 5). Legal and illegal immigrant women make up a smaller proportion of their respective prisoner populations than native‐born women, while men make up a higher proportion. The sex distribution of legal immigrant prisoners is far closer to that of native‐born Americans than to that of illegal immigrants.
<div class="long-form__wrapper container--medium-down">
Prisoners in every subpopulation are less educated than their total subpopulation (Table 6). About 63.7 percent of all native‐born adults, including those not incarcerated, have some college education or above, whereas 18.6 percent of native‐born prisoners have the same level of education. A total of 23.6 percent of legal immigrant prisoners and 14.4 percent of illegal immigrant prisoners have some college education or above, percentages that are lower than the percentages of their subpopulations with the same level of education (53.9 percent and 42.8 percent, respectively).27 Those in every immigration category who are highly educated tend to avoid incarceration.
<div class="long-form__wrapper container--medium-down">
Native‐born Americans and illegal immigrants have higher incarceration rates when they are young (Table 7). The peak incarceration rate for native‐born Americans and illegal immigrants is between ages 30 and 34. The legal immigrant incarceration rate peaks between ages 25 and 29.
<div class="long-form__wrapper container--medium-down">
The incarceration rates for legal and illegal immigrants generally increase with the amount of time they have spent in the United States, the major exception being the higher legal immigrant incarceration rate in the 0–4 years category that then falls once legal immigrants have been here for 5–9 years (Table 8). A possible reason for this phenomenon is that legal immigrants who are criminally inclined rapidly run afoul of the law, serve short prison sentences, and are removed from the United States quickly enough that the incarceration rate for the 5–9 years of residency category declines greatly.
<div class="long-form__wrapper container--medium-down">
Related to the amount of time immigrants have spent in the United States, illegal and legal immigrants who immigrate at a younger age are more likely to be incarcerated (Table 9). Illegal immigrants who arrive between ages 0 and 17 are about twice as likely to be incarcerated than those who arrive after age 17, suggesting that illegal immigrants who were old enough to choose to come here illegally are more law‐abiding than those who were brought here as minors.
<div class="long-form__wrapper container--medium-down">
The pattern is even more pronounced for legal immigrants. Those who immigrated between the ages of 0 and 17 were more than twice as likely to be incarcerated than legal immigrants who came at later ages. This again suggests that those old enough to choose to come to the United States legally are more law‐abiding.
At least two nonmutually exclusive theories can explain why those who entered in their youth have higher incarceration rates. First, spending part of one’s childhood in the United States assimilates many immigrants to our high‐crime culture. A second theory is that those who decide to come here have some systematically different characteristics that make them less likely to commit crimes, whereas those who are too young to make the decision to immigrate do not.
|
|
Return-To-Index
|
|
Msg ID:
2716398 |
Some advice +0/-0
|
Author:Old Guy
1/10/2022 12:52:29 PM
Reply to: 2716388
|
If you post data try and post data that is current. When a president changes and all of the policies about illegals changes, and they flood across our border, numbers change big time.
Also try to post data from stuff that is not just an option article.
I don't think anyone reads the cut and paste junk.
Even your post shows 83,698 illegals in prison, you think that is OK!
|
 |
Return-To-Index
|
|
Msg ID:
2716399 |
Note that the study refutes your argument that illegals are more likely +0/-0
|
Author:TheCrow
1/10/2022 12:55:07 PM
Reply to: 2716398
|
Note that the study refutes your argument that illegals are more likely criminals than native born. |
 |
Return-To-Index
|
|
Msg ID:
2716403 |
Teally +0/-1
|
Author:Old Guy
1/10/2022 1:08:31 PM
Reply to: 2716399
|
A study done by Alex Nowrusten, what a joke!
This man thinks Biden has not opened the boarders enough! |
 |
Return-To-Index
|
|
Msg ID:
2716401 |
"I believe you view illegal immigration the same as an legal immigration" +0/-0
|
Author:TheCrow
1/10/2022 1:03:29 PM
Reply to: 2716267
|
"I believe you view illegal immigration the same as an legal immigration"
No, I don't. I never said anything like that.
What I have said is:
America needs immigrants.
The American immigration process is dysfuntional. "Who you know", like Melania's parents, come to the country while people who will make real contributions to the economy and prosperity of America wait years to come- if ever.
I thought 'conservative' Republicans hated chain migration?
Melania Trump’s parents, Amalija and Viktor Knavs, flank their lawyer, Michael Wildes, heading to their naturalization ceremony in Manhattan on Thursday.Credit...Holly Pickett for The New York Times
President Trump has repeatedly and vehemently denounced what he calls “chain migration,” in which adult American citizens can obtain residency for their relatives.
On Thursday, his Slovenian in-laws, Viktor and Amalija Knavs, became United States citizens in a private ceremony in Manhattan by taking advantage of that same family-based immigration program.
Asked if the Knavses had obtained citizenship through “chain migration,” their lawyer, Michael Wildes, said, “I suppose.”
He said chain migration is a “dirtier” way of characterizing what he called “a bedrock of our immigration process when it comes to family reunification.”
Melania Trump had sponsored her parents for their green cards, Mr. Wildes said in describing the process by which the Knavses had become United States citizens. “Once they had the green card, they then applied for citizenship when they were eligible,” he said.
Even as his in-laws were going through the process, Mr. Trump was denouncing it. In November, he tweeted, “CHAIN MIGRATION must end now! Some people come in, and they bring their whole family with them, who can be truly evil. NOT ACCEPTABLE!”
Stephanie Grisham, the first lady’s communications director, said that because the Knavses are not part of the administration, “I’m not commenting on them.”
Ms. Grisham directed further questions concerning the president’s views on immigration — and the immigration status of his in-laws — to the West Wing, which did not immediately respond to emails and phone calls requesting comment.
The Knavses have a relatively high profile for presidential in-laws. They frequently travel with the Trumps and split their time between New York, Palm Beach and Washington, where they stay in the White House.
Since initial reports emerged in February that the Knavses had obtained permanent residency in the United States, there has been a lack of clarity about when or how the couple received green cards. And unless the couple themselves divulge the timeline of their citizenship process, the applications and petitions are protected by privacy law.
Under immigration statutes, the Knavses would have needed to have their green cards for at least five years in order to apply for citizenship, along with fulfilling character, residency and civic knowledge requirements. The time to process an application for naturalization in New York City typically ranges from 11 to 21 months, according to the U.S. Citizenship and Immigration Services.
Their lawyer said that the couple had met the five-year requirement, but added, “I can’t give further comment.”
News of the ceremony prompted an immediate response on Twitter.
Ana Navarro, a Republican strategist and political commentator, tweeted, “I guess when it’s Melania’s Family, it’s ‘family reunification’ and should be applauded. Everybody else, it’s ‘chain migration’ and must be stopped.”
But Mark Krikorian, the executive director of the Center for Immigration Studies, a think tank that supports tighter controls on immigration, said in an interview that the Knavses were following the law. “It’s the current system,” he said. “The question is what is the policy, and if a different policy is better, I’m all for it, but it doesn’t mean people working within the current policy are doing anything morally wrong.”
The president often rails against family-based immigration at his rallies, and has called it a pathway for terrorists to enter the country. He frequently reminds his audiences of the October terror attack in New York, where Sayfullo Saipov, an immigrant from Uzbekistan, plowed a pickup truck down a bike lane, killing eight people near the World Trade Center. While the president never names Mr. Saipov, who obtained his green card through the equally maligned diversity lottery, which grants visas to people from countries that have had fewer immigrants, he has been known to detail the attack.
“He said, ‘Hey look, there’s people, nice people, they’re relaxing, some are jogging,’” Mr. Trump said during a rally last week in Wilkes-Barre, Pa., lamenting the lives lost and those who were injured. “He decides to kill them.”
“They lost arms. They lost limbs. They lost so much. They lost their life. But they lost so much,” Mr. Trump added. “So, we have to change this and we’re going to change it.”
Typically, naturalization ceremonies at the Jacob K. Javits Federal Building at 26 Federal Plaza are large events, where groups of immigrants are sworn in as citizens en masse, after reciting an oath and the Pledge of Allegiance.
The Knavses’ lawyer said their ceremony was kept private for “security reasons.” Thomas Cioppa, New York district director of the U.S. Citizenship and Immigration Services, presided over the 20-minute ceremony, Mr. Wildes said. As is customary, the couple held their hands over their hearts and recited the Pledge of Allegiance, he said.
The Knavses, both in their 70s, raised Mrs. Trump in Sevnica, a Slovenian town of around 4,500 people. There, Mr. Knavs was a traveling car salesman and belonged to the Communist Party. Mrs. Knavs had harvested onions on her family’s farm, then worked in a textile factory, and sewed her two daughters’ clothes.
Mrs. Trump was born in 1970 and during her childhood Slovenia, then part of Yugoslavia, was ruled by Josip Broz Tito, a Communist dictator who nonetheless allowed more freedoms than other Eastern bloc leaders. When Mrs. Trump began her modeling career, while still a teenager, the whole family sensed opportunity, according to those who knew them in Slovenia.
According to news reports, she entered the country in 2001 on a so-called Einstein visa for “individuals of extraordinary ability” as a model. She became a United States citizen in 2006.
Mrs. Trump was not present for the ceremony, and her parents told their lawyer she was in Bedminster, N.J., where the president spends time in the summer at Trump National Golf Club.
The Federal Building also houses immigration court and the local offices of the Department of Homeland Security, and its subsidiary, Immigration and Customs Enforcement.
It is not infrequently the site of protests, but on Thursday, things were quiet as the first lady’s parents came and went. Curious about the cameras, bystanders wandered over. William White, a 74-year-old actor, said, with his eyebrows raised, “I’m happy for them.”
He went on: “It seems like we now have two immigration systems. One for the people who have no power, and one for the people who we are letting in through the V.I.P. entrance. We saw an example of that today.”
Katie Rogers contributed reporting from Washington.
Follow Annie Correal and Emily Cochrane on Twitter: @anniecorreal and @ESCochrane
A version of this article appears in print on Aug. 10, 2018, Section A, Page 1 of the New York edition with the headline
|
|
Return-To-Index
|
|
Msg ID:
2716255 |
Unless your last name is: Arrow; Blackrock; Bravebird; Huaman; Summerhill +1/-0
|
Author:TheCrow
1/8/2022 5:04:45 PM
Reply to: 2716242
|
Arrow - given to a hunter.
Blackrock - a family from the black rock area.
Bravebird - based on a bird's trait.
Huaman - hawk. Pompey - five.
Summerhill - a family that lives on a hill.
Swiftwater - a family that lives near swift water.
Thunderhawk - based on the power of thunder, combined with the word hawk. T
sosie - slim. Vance - from the marsh.
Warcloud - from the words war and cloud.
Welch - foreign.
Read more: https://www.legit.ng/1397038-50-native-american-last-names-surnames-and-their-meanings.html |
|
Return-To-Index
|
|