|
Msg ID:
2730954 |
First Jury decision back from Durham Probe into "Hillary Gate" +5/-0

|
Author:bladeslap
5/31/2022 1:31:52 PM
|
NOT GUILTY
All those millions spent, with Trump's hand-picked prosecutor (Durham) has been a flop
Trump roasted by legal experts after hand-picked Russiagate prosecutor John Durham suffers 'big fat loss'
Former President Donald Trump's special counsel John Durham has spent three years trying to sink members of Hillary Clinton's 2016 campaign for supposedly trying to frame Trump over his connections to Russia.
On Tuesday, after seven hours of deliberation, the jury concluded that the Clinton campaign lawyer, Michaell Sussmann was innocent of lying to the FBI when he turned over information that they discovered.
The verdict drew commentary from legal analysts who mocked Republicans who swore that Durham would reestablish Trump's credibility when it came to any accusation involving Russia. That effort, however, failed.
Meanwhile, Durham spent $2.36 million in tax-payer dollars over the course of three years, doing nothing other than making wild accusations in court filing documents |
 |
Return-To-Index
|
|
Msg ID:
2730971 |
�You all look like idiots now�: Legal experts mock Trump after John Durham� +5/-0
|
Author:TheCrow
5/31/2022 3:43:57 PM
Reply to: 2730954
|
"What a roaring waste of money and time," criminal defense attorney says after special counsel loses Clinton case
PUBLISHED MAY 31, 2022 1:30PM (EDT)

Donald Trump, Hillary Clinton and John H. Durham (Photo illustration by Salon/Getty Images/United States Attorney's Office, District of Connecticut)save
This article originally appeared on Raw Story

Former President Donald Trump's special counsel John Durham has spent three years trying to sink members of Hillary Clinton's 2016 campaign for supposedly trying to frame Trump over his connections to Russia.
On Tuesday, after under seven hours of deliberation, the jury concluded that the Clinton campaign lawyer, Michaell Sussmann was innocent of lying to the FBI when he turned over information that they discovered.
The verdict drew commentary from legal analysts who mocked Republicans who swore that Durham would reestablish Trump's credibility when it came to any accusation involving Russia. That effort, however, failed.
Meanwhile, Durham spent $2.36 million in tax-payer dollars over the course of three years, doing nothing other than making wild accusations in court filing documents, according to Sussmann's lawyer.
In a Feb. 2022 rebuttal filing, Sussmann's lawyers attacked Durham's court claims, saying that he was wrong about critical facts. According to their information, Durham's claim that Trump's White House was being spied on in the Oval Office was a lie. Evidence showed that all of the data was legally and properly obtained prior to Trump taking office. The claim also went on to say that Durham was making wild accusations in his court documents to give fodder to right-wing media.
As former federal prosecutor Elie Honig explained, he predicted this case wouldn't go the way Trump hoped.
"That sound you heard — that muffled thud, off in the distance of southern New England — that was the sound of the much-ballyhooed John Durham investigation as it reached its pathetic anticlimax. That was the sound of a dud," wrote Honig in a Sept. 2021 editorial. He concluded that the comments hold true eight months later.
"So the crux of the indictment is that Sussman didn't disclose to the FBI that he represented Clinton — but the FBI knew he represented Clinton anyway. That, folks, is what we prosecutors call a problem," he said last year.
"We have always known that Michael Sussmann is innocent and we are grateful that the members of the jury have now come to the same conclusion," said a statement from lawyer statement from Sean Berkowitz. "But Michael Sussmann should hever have been charged in the first place. This is a case of extraordinary prosecutorial overreach. And we believe that today's verdict sends an unmistakable message to anyone who cares to listen: politics is no substitute for evidence, and politics has no place in our system of justice."
|
 |
Return-To-Index
|
|
Msg ID:
2730978 |
The end of our country! +3/-3
|
Author:Old Guy
5/31/2022 6:19:50 PM
Reply to: 2730954
|
This proves without any doubt just how corrupt the left has become. Pick jurors that donated to the election of Hillary, tell them how to decide and then call it justice.
Our nation is officially now a third world nation.
It did not take long for the left to totally destroy a once great nation. |
|
Return-To-Index
|
|
Msg ID:
2730980 |
The Jury Heard The Evidence And Rendered A Decision... +5/-0
|
Author:Jett
5/31/2022 6:48:25 PM
Reply to: 2730978
|
Of Not Guilty! That's the way the American system of justice works. I know it's not the decision you wanted, just like trump getting off the hook on some of his stuff like Jan 6 is not what I wanted, but that's the American way.
You already live in a different country, (Idaho) so I won't suggest you move... |
 |
Return-To-Index
|
|
Msg ID:
2730981 |
The end of our country! +4/-0
|
Author:TheCrow
5/31/2022 6:50:51 PM
Reply to: 2730978
|
"Pick jurors that donated to the election of Hillary, tell them how to decide and then call it justice."
Both sides shape the jury, exclude those they doubt can render a reasonable judgement.
Trummpists are absolutely un-American: object to elections and now juries.
|
|
Return-To-Index
|
|
Msg ID:
2731016 |
Shows how little you know +2/-4
|
Author:Old Guy
5/31/2022 9:40:36 PM
Reply to: 2730981
|
The lefty judge limited the jury picks! 5 jurors are directly linked to Hillary. Go ahead you can believe this legal system is still real justice, but you are wrong. Just like election court cases, this case was a basic kangaroo court?
Citizens are getting sick of it. The country is sick of it! Did you know that the 8 biggest lefty cities are losing population, people are sick of the left.
Wait for the midterms, democrats are going to get crushed.
|
 |
Return-To-Index
|
|
Msg ID:
2731023 |
Yes, we are sick of it! +4/-0
|
Author:Jett
5/31/2022 11:57:22 PM
Reply to: 2731016
|
We are sick and tired of all you Extreme Righties every time something doesn't go your way claiming it's "Rigged", it's "Fraud". Grow a pair, you don't win every time!
I think people are sick of conservative freaks light Greene and QAnon believers.
But I tell you what, when I read trumps quotes on this issue today I almost cried laughing so hard. That made it so worth it!
You're Sore Losers and you're Cry Babies, but you are right about the mid-terms it looks like the left will lose a significant number of seats. What we won't do is claim that it's "Rigged" or it's "Fraud" like you pussies...
|
 |
Return-To-Index
|
|
Msg ID:
2731062 |
Did you know that the 8 biggest lefty cities are losing population, people +3/-0
|
Author:TheCrow
6/1/2022 11:44:53 AM
Reply to: 2731016
|
"Did you know that the 8 biggest lefty cities are losing population, people are sick of the left."
Nonsense. People are sick of the crowding, the traffic and the expense of the big city.
The politics in cities is no different than politics anywhere else, with one exception: cities generally have higher education levels than rural, small-town America.
The big city residents expect more services from their municipal governments, so they vote for those who will provide more services be they left, right or centrist.
Not all urban areas are bastions of blue. Population, density and education all play a role.
MPI's Zara Matheson
February 19, 2013, 7:00 AM EST
In his first interview after the election, Republican vice-presidential candidate Paul Ryan attributed Barack Obama's victory to "the turnout especially in urban areas, which gave President Obama the big margin to win this race."
Sam Tanenhaus's recent cover story in the The New Republic provides fascinating — and ironic — historical perspective. Back in 1968, when Kevin Phillips was formulating the infamous "Southern strategy" that secured Nixon the White House, he was willing to dispense with big city votes altogether. "Who needs Manhattan when we can get the electoral votes of eleven Southern states?" Phillips asked. "Put those together with the Farm Belt and the Rocky Mountains, and we don't need the big cities. We don't even want them."
The old GOP strategy, Tanenhaus observes,"was built for a different time, and a different America." Of the 15 largest U.S. cities, 11 went for Obama this past November. Not just the big, traditionally blue cities of the Northeast, Midwest, and West Coast, but a number of fast-growing Sun Belt cities as well.
Just as cities and metros provide the economic engine of the U.S. economy — generating 85 percent of economic output — they have also become a singular political force.
But what are the factors that are shaping their votes and redefining U.S. politics? To what degree — and why — might this "metro-ification" of American politics work in favor the Democrats and against the GOP?
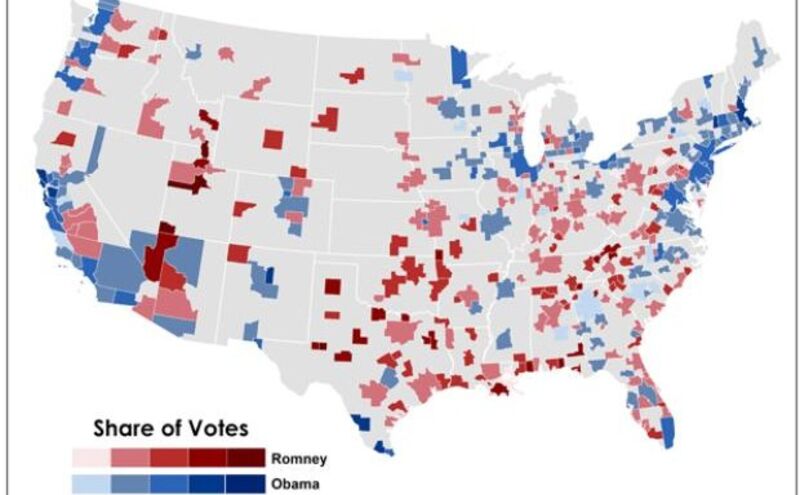
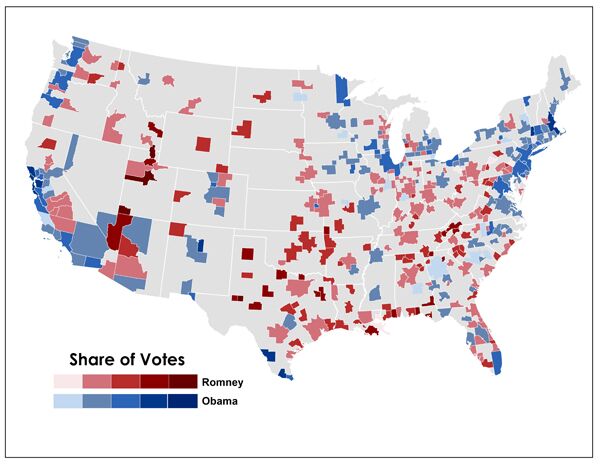
Election returns are not collated by metro, but county-level results are available. My Martin Prosperity Institute colleague Zara Matheson matched the county-level data provided by The Guardian to the metros made up by those counties, and then mapped the shares of Obama versus Romney vote for every metro in the lower 48 states.
Obama took the coastal metros in New England, the Northeast, and across much of the Eastern seaboard, from Portland, Maine and Boston to Washington, D.C., and even as far south as Charlotte and Atlanta (which Obama took by small margins), and Orlando as well as Miami. On the West Coast, Obama won the big metros, from Seattle and Portland down to San Francisco and Los Angeles. The President took many of the bigger metros of the Great Lakes region — Chicago, Minneapolis-St. Paul, Detroit, Cleveland, Buffalo, and Rochester. The President took 56 percent of the vote in Las Vegas, 55 percent in Denver, and 54 percent in Albuquerque. He also did well in several Texas metros, winning more than three-quarters of the votes in heavily Hispanic Laredo, 70 percent of the votes cast in McAllen, and more than two thirds of the votes cast in El Paso and Brownsville.
The average Obama metro is home to more than one million people, more than double the size of the average Romney metro.
Romney, on the other hand, dominated smaller and medium-size metros in the Sun Belt. He won Provo, Utah, with 88 percent of the vote, and took eight out of 10 voters in Amarillo, Texas. In fact, four of the 10 metros that gave Romney his biggest margins were in Utah: Logan (84.3 percent), St. George (82.6 percent), and Ogden (77.2 percent) are the others. Three of Romney's top-10 metros were in Texas: Midland (80 percent), Abilene (76.9 percent), and Wichita Falls (75 percent). Romney carried roughly 60 percent of the vote in Oklahoma City; Birmingham, Alabama; and Jacksonville, Florida (which he won by an even bigger margin than Salt Lake City). He carried Dallas, Houston, and Phoenix, and Nashville with 55 or so percent of the vote.
Romney was also competitive in a number of older industrial metros. He took the old industrial regions of Wheeling (57 percent) and Weirton, West Virginia (54 percent), and Johnstown, Pennsylvania (58 percent), as well as Dayton (53.5 percent) and Cincinnati, Ohio (57.7 percent) by considerable margins. He even eked out victories in the once-blue strongholds of greater Milwaukee (51.7 percent) and Pittsburgh (with 50.03 percent vs. 48.8 percent for Obama). The once solidly-Democratic industrial belt is now mixed.
All told, Romney won more metros than Obama did, 214 to 150. But the President won the biggest, taking more than 60 percent of the vote in New York, L.A., and Chicago. Metros with more than one million people went for Obama by a margin of 53.4 percent to 45 percent for Romney. Metros with fewer than 250,000 people went decisively for Romney, by a margin of 55.6 percent to 42.6 percent. Metros between 500,000 and one million people were close, tilting 49.7 percent Romney to 48.6 percent for Obama; metros with between 250,000 and 500,000 people went for Romney as well, 50.7 to 47.6 percent. The average Obama metro is home to more than one million people, more that double the size (413,000 people) of the average Romney metro.
• • • • •
But what is it specifically about big metros that made them trend blue?
To get a better sense of this, my MPI colleague Charlotta Mellander ran basic correlations between the share of metro votes for Obama and Romney and metro characteristics like education, income, occupation and socio-economic class, population density, and commuting patterns. As usual, I point out that correlation points to associations between variables only, not causation.
Density played a key role in the metro vote. (To capture it we use a measure we of population-based density, which accounts for the concentration of people in metro). The average Obama metro was more than twice as dense as the average Romney metro, 412 versus 193 people per square mile. With a correlation of .50, density was an even bigger factor than population (where the correlation is .34). The reverse pattern holds for the share of Romney votes; the negative correlation for density (-.51) was significantly higher than that for population (-.33).
The concentration and clustering of people is a key factor in innovation and economic growth; it also seems to turn metros blue. Shortly after the election, Maryland-based entrepreneur Dave Troy identified the inflection point when counties turn from red to blue as roughly 800 people per square mile. "[B]elow 800 people per square mile," he wrote on his website, "there is a 66 percent chance that you voted Republican. Above 800 people per square mile, there is a 66% chance that you voted Democrat. A 66 percent preference is a clear, dominant majority."
Education was another big factor in the metro vote. Economists have long noted how the clustering of highly-skilled, highly educated people powers the economic growth of cities. And as with density, the higher the level of education for a metro, the more likely it is to be blue. This becomes clear when we break metros into four groups, or quartiles, by their share of college grads. Obama took the top quartile — those with the largest shares of college grads — by a ten percent margin, 54.2 to 44 percent (the other three quartiles went for Romney).
The chart below plots the relationship between a metro's share of college grads and its share of Obama votes. The line slopes steeply upward showing how the share of Obama votes increase alongside metro density. The share of college grads in a metro is positively correlated with the share of Obama votes (.42) and negatively with the share of Romney votes (-.44).
The kind of work voters do — economic class — also helped shape their partisan voting patterns in metros. Creative class metros — those with high concentrations of workers in science and technology; business and management; healthcare, education, and arts, culture and entertainment — voted for Obama; working class metros went for Romney. Obama's edge in metros with the top quartile of creative class workers was 14 points, 56 percent to 42 percent. Romney, on the other hand, won 80 percent of the metros in the top quartile for the working class.
The chart above shows the relationship between the share of the creative class and the share of Obama votes across metro areas. The line slopes steeply upward, indicating a considerable positive relationship. The share of creative class workers is positively correlated with the share of Obama votes (.40) and negatively with the share of Romney votes (-.41).
Romney may have positioned himself as the candidate of high-tech industry, but high-tech metros were more likely to fall in Obama's camp. The President won more than two-thirds of the vote in Silicon Valley (the San Jose metro) and Boulder, which Business Week named the top metro for start-ups; more than three-quarters of the vote in San Francisco and Boston; and more than 60 percent in Seattle, home to Microsoft and Amazon. The concentration of high-tech industry across metros is positively associated with Obama votes (.35) and negatively with Romney votes (-.35).
Not just the kind of work we do, but the way we get to work is associated with metro voting patterns. Across metros, the share of Obama votes is positively associated with the share of commuters who take public transit (.44), bike (.30), and walk (.33) to work (the correlations are substantially higher when we consider large metros alone). Metros where workers drive to work alone went for Romney (with a correlation of .37). Of course, transit is much more available in denser metros, and people are more likely to live closer to where they work as well, so this finding also likely reflects the role of density.
For all of Obama's union endorsements, metros with larger shares of blue-collar workers in manufacturing, transportation, and construction voted for Romney (with a correlation of .46) and against Obama (-.45). The chart above graphically shows this, plotting the relationship between a metro's share of blue collar workers and its Obama vote. The line slopes steeply downward, showing the the negative relationship between the percentage of blue-collar workers and the share of Obama votes. The higher the share of working class votes in the metro, the less likely it was to vote for Obama.
These results are in line with a detailed analysis of county voting patterns from 1988 through 2008 that I conducted with my National Journal colleague Ronald Brownstein last September. Over the past 25 years, counties with higher creative class shares have trended more and more Democratic. In 1988, the Democratic margin in counties with the highest creative class concentrations was a substantial 6.1 percent; by 2008 it had ballooned to an overwhelming 23.7 percent. As Brownstein put it, a class inversion — in which college educated white professionals were increasingly voting Democratic — had "reshaped the electoral landscape," creating a powerful new source of class advantage for the President. A few weeks ago, Brownstein also noted that "so many of the blue-collar and older whites who formerly anchored the conservative end of the Democratic base" have virtually "abandoned" Obama.
Republicans may still be the party of the rich, but most of the country's more-affluent metros lined up squarely in the Obama camp. The correlation between the average wages and salaries of metros and the share of Obama votes is positive (.50) and it is negative for Romney votes (-.51). This makes sense too, as larger metros have greater concentrations of knowledge-based talent and industries and are wealthier to begin with. (The associations we find are even more substantial for metros with more than one million people, with the correlations increasing to .71 for Obama and -.72 for Romney.) This follows the "Red State, Blue State, Rich State, Poor State" pattern identified by Andrew Gelman of Columbia University, who infamously found that while rich voters continue to trend Republican, rich states trend Democratic.
Interestingly — and contrary to the much-stated view that Obama purchased the election with welfare, food stamps, and other entitlements (in Rush Limbaugh's words, "It's just very difficult to beat Santa Claus"), our analysis turned up no statistically significant association between Obama votes and the metro poverty rate and only a very small one for income inequality across metros.
Then there's the widespread perception that blacks and Hispanics gave Obama his decisive edge. While Obama clearly carried black and Hispanic voters, race appears to have played less of a role at the metro level. Surprisingly, Mellander found no statistically significant association between a metro's share of black residents and the share of Obama votes and only a weak association between a metro's share of Hispanic residents and Obama's vote share (.17).
Diversity did play a role in the metro election, but across different dimensions than race. There is a considerably stronger positive correlation between a metro's foreign-born share and Obama votes (.38), and a negative correlation to Romney votes (-.38) — which is precisely why many Republicans are re-thinking the political wisdom of their anti-immigration stance.
Obama's shift on gay marriage in May of 2012 might well have paid dividends in November. There is a positive correlation a metro's Gay and Lesbian Index and its share of Obama votes (.49), and a negative one between it (-.50) and the share of Romney votes (see the chart above).
• • • • •
America's political divide is an outgrowth of its increasingly divided economic landscape. The very same forces of talent-clustering and knowledge industry concentration that shape the divergent economic fortunes of our cities and regions, increasingly shape our politics. Affluent, high-tech, creative class metros — big ones like New York and L.A., high-tech ones like San Jose, Seattle, Boston, and San Francisco, and smaller college towns like Boulder, Madison, and Ann Arbor — are mostly blue. Less advantaged, less skilled metros in the Sun Belt and even in the Midwest are increasingly red.
America is divided between cities of knowledge and skill and the rest. The residents of these knowledge cities not only do better economically, they are better-traveled, better-connected to the global economy, and more open to diversity. Perhaps because the work of the knowledge-based metros centers turns on knowledge, creativity, and abstract thinking, their residents tend to be more open to the notion that government can help improve the economy, better the environment, provide essential services (like healthcare), and protect the fundamental rights of disadvantaged or discriminated-against groups. (This is in line with Ronald Inglehart's detailed research on the shift from interest-serving "materialist" politics to a more "post-materialist politics" — which puts more emphasis on individual self-expression, shared rights, and public goods — in knowledge-based economies).
Those who live outside these places see knowledge-based centers as elitist and coddled by government. They are well aware of the growing gap between the metro haves and have-nots, and know they are losing ground. They'd like to somehow stop the forces of change that are leaving them behind and bring back the good old days when they, and their more traditional vision of, America was on top.
This divide is as economic and geographic as it is partisan. America's polarized politics is a product of its deeply-etched geography of class.
|
|
Return-To-Index
|
|
Msg ID:
2731064 |
Good post for 9 years ago, NO CURRENT VALUE! (NT) +1/-2
|
Author:Old Guy
6/1/2022 11:57:41 AM
Reply to: 2731062
|
|
 |
Return-To-Index
|
|
Msg ID:
2731087 |
You can read this anywhere... or see it yourself. +4/-0
|
Author:TheCrow
6/1/2022 3:33:02 PM
Reply to: 2731064
|
It's not news, it's been happening for decades.
Due to the pandemic, growth trends in cities like LA and New York are going downward, while smaller cities are booming
By Ashley Nash
Mar 25, 2022, 12:00am EDT

A pedestrian carries an umbrella while looking toward the skyline from Dolores Park in San Francisco, Monday, Dec. 13, 2021.
The New York Times reported that 2021 was the slowest year of growth in U.S. history.
Two main factors included COVID-19 mortality rates and migration within the country, both of which were a result of the many ways the pandemic has changed the country’s population.
Migration out of large cities: “The pandemic intensified population trends of migration to the South and West, as well a slowdown in growth in the biggest cities in the U.S,” reported The Associated Press.
Between 2020 and 2021:
- The Los Angeles metro area lost 176,000 residents.
- San Francisco saw a decrease of 116,000 residents.
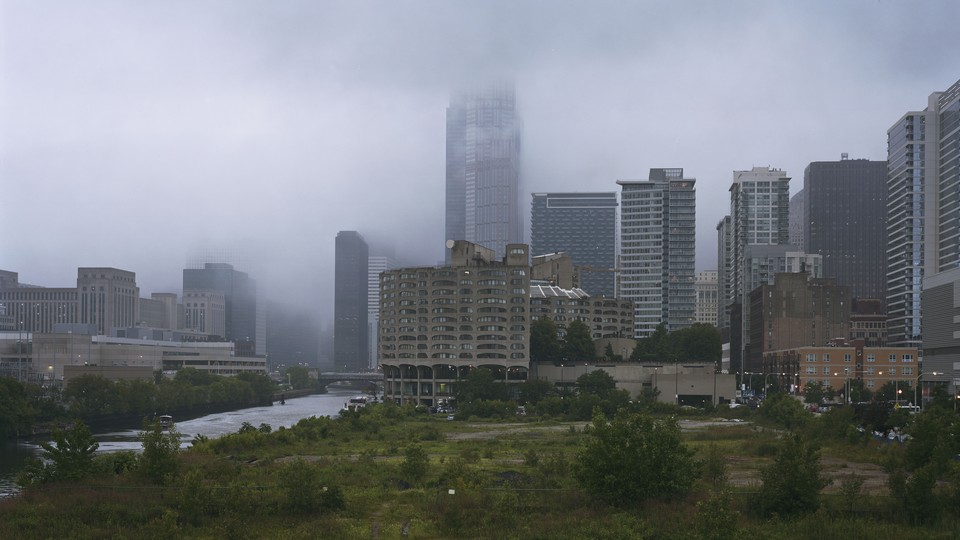
- Chicago lost 91,000 people.
- San Jose, Boston, Miami and Washington, D.C., all lost tens of thousands of residents, according to AP News.
- “The exodus from the biggest U.S. metropolitan areas was led by New York, which lost almost 328,000 residents,” reported ABC Los Angeles.
Growth in smaller cities: On the other end, The Associated Press reported that some smaller U.S. cities saw growth in 2021.
- Phoenix increased by 78,000, and Houston saw an addition of 69,000 people.
- Small areas like Kalispell, Montana; Jefferson, Georgia; and Bozeman, Montana experienced growth as well.
- Business Insider shared a map that details the population changes within each county, based on U.S. Census data.
- This map shows growth within Western states such as Utah and Idaho, but an increase in population on the East and West coasts.
Why are people leaving big cities? There are a number of reasons why people are leaving.
- “In Houston, I can be a blue-collar entrepreneur. With the Houston housing market, it made sense to come here,” said Anthony Giusti, a former San Francisco resident, to The Associated Press.
- In San Francisco, the high cost of living ensured that even with two jobs, Giusti would never be able to afford a house in the area. He moved to Houston where he is now able to comfortably support himself.
- “The price of living in the Bay Area was so out of sync with the quality of life we were getting,” said Alison Grady to The New York Times.
- According to a 2021 Los Angeles Housing report, half a million low-income renters do not have access to affordable housing in the Los Angeles area.
- The report also stated that residents of LA would need to earn $38.23 per hour to afford the average monthly rent of $1,988 in the area.
Shrinking population: “Only 828 counties had more births than deaths in 2021, the figures show, down from more than 1,900 a year ago,” reported The New York Times.
- Half of the states in the U.S. saw more deaths than births in 2021, this phenomenon is known as “natural decrease,” according to Axios.
- “In 2021, fewer births, an aging population and increased mortality — intensified by the COVID-19 pandemic — contributed to a rise in natural disease,” said the U.S. Census Bureau, according to Reuters.
|
 |
Return-To-Index
|
|
Msg ID:
2731092 |
Here's another article, and again- nothing to do with the big city politics +4/-0
|
Author:TheCrow
6/1/2022 3:57:38 PM
Reply to: 2731064
|
The rise of remote work has snipped the tether between home and office, allowing many white-collar workers to move out of high-cost cities.
Sign up for Derek’s newsletter here.
Pop quiz: What do the metros of New York City, Los Angeles, Chicago, Miami, Boston, Seattle, San Francisco, San Diego, Minneapolis–St. Paul, Philadelphia, and Washington, D.C., have in common?
They are all among the 20 largest metropolitan areas in the country. All of their populations were growing in 2011. And then, in 2021, they all shrank by a combined 900,000 people, according to an analysis of census data by the Brookings scholar William Frey. That’s an urban exodus nearly the size of two Wyomings.
The great metro shrinkage is part of a larger demographic story. Last year, the U.S. growth rate fell to a record low. The major drivers of population—migration and births—declined, while deaths soared in the pandemic. But America’s largest cities are getting the worst of this national trend. In the past three years, the net number of moves out of Manhattan has increased tenfold. In every urban county within the metros of New York City, Los Angeles, and San Francisco, immigration declined by at least 50 percent from 2018 to 2021. In downtown Detroit and Long Island, deaths actually exceeded births last year.
The great metro shrinkage also appears to be part of a broader cultural story: The rise of remote work has snipped the tether between home and office, allowing many white-collar workers to move out of high-cost cities. Nearly 5 million Americans have moved since 2020 because of remote-work opportunities, according to Adam Ozimek, the chief economist for the Economic Innovation Group, a think tank in Washington, D.C.
Historically, shrinking cities and towns have major economic and cultural problems. But something pretty strange is happening in America’s biggest metros: Their housing markets aren’t suffering the way you’d expect. In fact, rents and housing prices are going up in almost all of these metros. In the past year, rents rose 33 percent in New York City, 16 percent in Los Angeles, and 12 percent in Chicago. Since the pandemic, rents are up in every city on the above list, except for San Francisco.
So what we have here is a bit of an urban mystery. If America’s biggest metros are shrinking, why are their housing markets on fire? And if rents are rising in almost all of these cities, how can they possibly be shrinking?
There are a few possible answers. One is that the census data are just wrong. For example, the government may have failed to count families that have been moving around during COVID waves, taking extended breaks from their city apartments without actually abandoning them. Or maybe the census took an accurate snapshot of city-population levels in 2021 but hasn’t yet caught up to people surging back into America’s biggest cities in the past few months, creating yet another great urban renewal. In these scenarios, many places that looked imperiled during the data-collection process are actually crowded and booming right now.
A second possibility is that my somewhat-dystopian prediction from 2019 is coming true: America’s densest cities are becoming playgrounds for the rich and mostly childless. In 2001, L.A. County recorded 153,000 live births. In 2021, it recorded fewer than 100,000 births. Perhaps middle-class workers and families with young kids used the pandemic as an opportunity to accelerate their move to the suburbs or cheaper towns. As poorer and younger families left, richer and older people stayed, and some affluent young people moved in. In this scenario, some cities might have gotten richer even as they got smaller, pushing up rents and home prices.
The third, simpler answer is: It’s inflation, stupid. That is, cities really are struggling with population loss, but urban rents and housing values are rising along with national inflation, which is surging toward 10 percent.
This seems like a potent explanation. The Stanford economist Nick Bloom has pointed out that in a reversal of history, big cities such as New York and San Francisco, which saw the fastest rent growth from 1980 to 2019, are now seeing some of the slowest rent growth in the country. With inflation at a 40-year high, many cities are experiencing rent growth that is both very high and also significantly slower than the national average.
What all of this means is that America’s superstar cities might be in a little more trouble than we think—even if that trouble is currently obscured by high inflation. According to Ozimek’s research, the share of Americans who say that they are planning on moving because of remote work has increased by 50 percent since October 2020, to more than 9 percent of the country. If true, that means that about 19 million people, or the population of New York State, are strongly thinking about moving because of the freedom afforded by remote work. Cities with a high cost of living and white-collar jobs that can be done remotely—such as San Francisco—are the most likely to see more out-migration in the next few years, especially as Sun Belt metros continue to add more houses than coastal cities.
Bold predictions of urban death have rarely come true. But urban death and urban struggle are not the same. “I think arguing against urban struggle by pointing to centuries of a general trend towards urbanism is smoothing over some pretty bad times for cities,” Ozimek told me. “The 1970s happened.”
So what might this period of urban struggle look like? Just check out what’s happening now. Mass-transit ridership has collapsed from its pre-pandemic highs in New York, Boston, the Bay Area, and Washington, D.C. Although restaurant bookings and travel have bounced back almost entirely, office occupancy remains 50 percent below its 2019 levels. In San Francisco, vacant office space has nearly quadrupled since the pandemic to 18.7 million square feet. In New York, Mayor Eric Adams has practically begged white-collar workers to return to Midtown, even as those workers patronize businesses in more residential parts of the city, closer to where they live. America’s downtown areas support millions of jobs that can’t be made remote—in retail, construction, health care, and beyond. But for millions of white-collar workers, something important has changed: They don’t work “in” cities anymore. They work on the internet. The city is just where they go for fun.
With rising prices and shrinking populations, with emptier downtowns and bustling residential neighborhoods, with booming leisure and busted offices, the near future of America’s richest cities could be pretty weird.
|
|
Return-To-Index
|
|
Msg ID:
2731080 |
Sore that the jury did not agree? +3/-0
|
Author:bladeslap
6/1/2022 1:17:37 PM
Reply to: 2730978
|
Yet another example - You know everything and the jury knows nothing.
Typical Old guy |
|
Return-To-Index
|
|