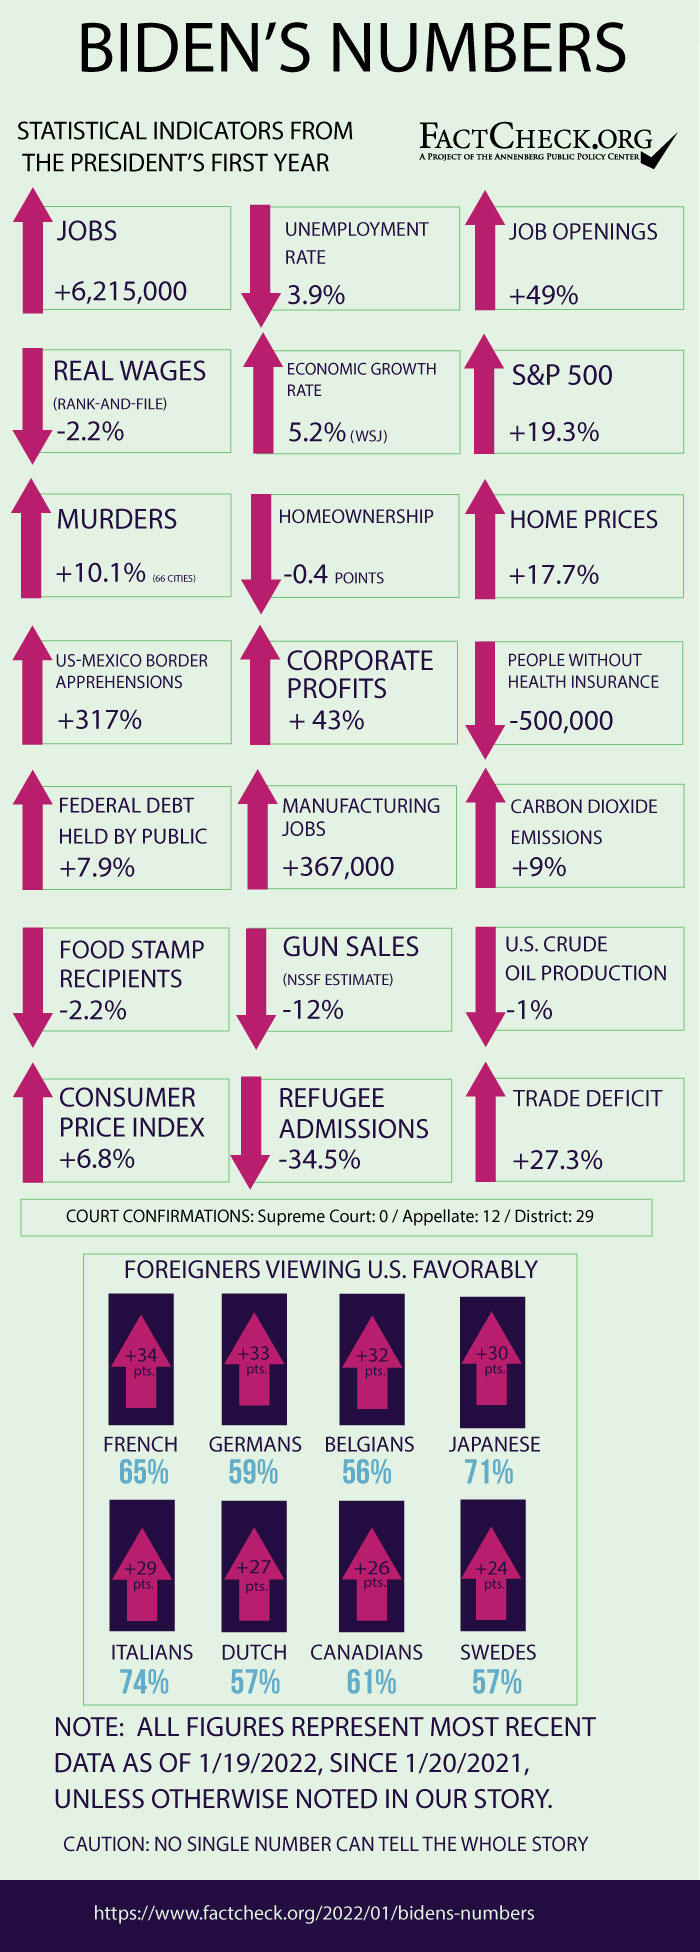
Summary
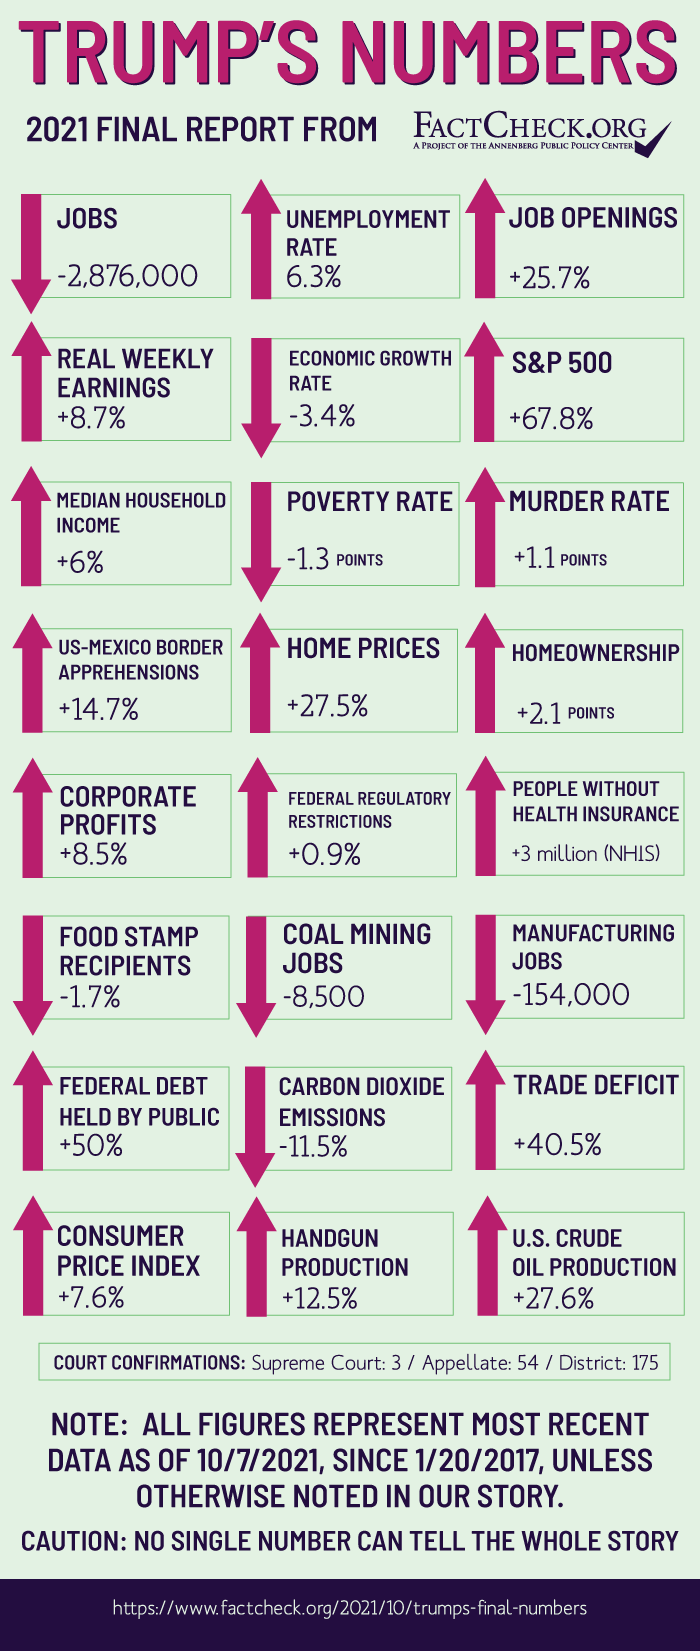
The statistics for the entirety of Donald Trump’s time in office are nearly all compiled. As we did for his predecessor four years ago, we present a final look at the numbers.
- The economy lost 2.9 million jobs. The unemployment rate increased by 1.6 percentage points to 6.3%.
- Paychecks grew faster than inflation. Average weekly earnings for all workers were up 8.7% after inflation.
- After-tax corporate profits went up, and the stock market set new records. The S&P 500 index rose 67.8%.
- The international trade deficit Trump promised to reduce went up. The U.S. trade deficit in goods and services in 2020 was the highest since 2008 and increased 40.5% from 2016.
- The number of people lacking health insurance rose by 3 million.
- The federal debt held by the public went up, from $14.4 trillion to $21.6 trillion.
- Home prices rose 27.5%, and the homeownership rate increased 2.1 percentage points to 65.8%.
- Illegal immigration increased. Apprehensions at the Southwest border rose 14.7% last year compared with 2016.
- Coal production declined 26.5%, and coal-mining jobs dropped by 16.7%. Carbon emissions from energy consumption dropped 11.5%.
- Handgun production rose 12.5% last year compared with 2016, setting a new record.
- The murder rate last year rose to the highest level since 1997.
- Trump filled one-third of the Supreme Court, nearly 30% of the appellate court seats and a quarter of District Court seats.
Analysis
In the fall of 2020, we published a preelection update to our quarterly “Trump’s Numbers” series, and on President Joe Biden’s inauguration, we examined several statistical indicators on what he inherited. But as we noted then, the books weren’t yet closed on the Trump presidency.
It takes several months for some of the data to be finalized. While it’s likely some numbers will be revised in the future, we now have measures for Trump’s complete time in office.
Some of these figures, notably the net job loss and gross domestic product, were affected by the COVID-19 pandemic, which struck in Trump’s final year in office, becoming a defining issue of his tenure. Scientists quickly developed very effective vaccines, two of which were authorized for emergency use in the U.S. while Trump was still president in December 2020. But by the day Trump left office, 401,000 people had died from the disease caused by the novel coronavirus, and the economic fallout was far from over.
Some data points appeared to weather the economic impact: After-tax corporate profits and crude oil production rose, and the stock market, after taking an initial hit, continued to set records. Other statistics run counter to claims or promises Trump made: For instance, illegal immigration, the trade deficit and the federal debt — measures he vowed to lower — went up instead, rising even before the 2020 global pandemic began.
As we’ve often said, readers may find these statistics to be good, bad or neutral, and opinions differ on how much credit or blame a president should get for what happens while he is in office. We leave those judgments to others.
Jobs and Unemployment
As a candidate, Trump proclaimed: “I am going to be the greatest jobs president that God ever created.”
As president, Trump saw 100 months of continuous U.S. monthly job gains end in February 2019 as the economy slowed. In 2020, job growth collapsed entirely when COVID-19 went from being a localized problem in Wuhan, China, to a global pandemic.
Employment — A record eight years and four months of monthly job gains — dating to October 2010 — ended February 2019, roughly a year before the pandemic. The U.S. lost 50,000 jobs that month. The U.S. would go on to add 2 million jobs in 2019, but that was the lowest annual growth since 2010.
And then the novel coronavirus struck. In two months, March and April 2020, the U.S. economy lost a staggering 22.4 million jobs.
Most of those jobs (56%) would return before Trump left office. But he ended his presidency with an economy that had 2.9 million fewer jobs than when he started — becoming the first president in modern times to experience a net loss of jobs over his time in office, according to the Bureau of Labor Statistics, which has monthly employment figures dating to 1939.
Unemployment — As a candidate, Trump frequently criticized the monthly unemployment rates as “phony numbers.” But as president, Trump immediately began to take credit for driving down the unemployment rate, which at 4.7% was already close to full employment when he took office in January 2017. Two months into Trump’s term, then-White House Press Secretary Sean Spicer joked about his boss’s change of heart: “I talked to the president prior to this, and he said to quote him very clearly — ‘They may have been phony in the past, but it’s very real now.’”
The unemployment rate would continue to drop under Trump — until the pandemic. A month before widespread lockdowns would virtually shut down the economy, the unemployment rate stood at 3.5% in February 2020, the lowest since December 1969. During the pandemic, the unemployment rate peaked at 14.8% in April 2020, the highest since BLS began tracking the figure in 1948.
When Trump’s term ended in January 2021, the unemployment rate was 6.3% — which was 1.6 percentage points higher than when he took office, but still lower than the unemployment rates when Presidents Jimmy Carter (7.5%), George H.W. Bush (7.3%) and George W. Bush (7.8%) left office.
Job Openings — For nearly two years, Trump and the White House boasted that the U.S. had more job openings than workers to fill them. That was the case for 23 straight months from March 2018 through February 2020 — a month before the pandemic lockdown began to swell the ranks of the unemployed.
When Trump left office, the number of unfilled job openings stood at just 7.1 million — which was 25.7% more than when he took office. But, because of the COVID-19-induced high unemployment rate, there were still 3 million more job-seekers than job openings.
Labor Force Participation — Republicans frequently blamed then-President Barack Obama for a declining labor force participation rate — which is the percentage of the population age 16 and older that is either employed or looking for work in the previous four weeks. It’s true that the labor force participation rate declined, from 65.7% to 62.8%, during Obama’s two terms — although the downward trend began in 2000 and continued during Obama’s time in office, largely due to demographics, including the retirement of baby boomers.
Under Trump, the rate seemed to stabilize and even ticked upward, reaching a high of 63.4% in January 2020. But, by the time he left office, the rate had dropped to 61.4% — falling another 1.4 percentage points under Trump after going down 2.9 points during the Obama years.
A working paper published by the National Bureau of Economic Research found “the onset of the covid-19 crisis led to a wave of earlier than planned retirements.”
Manufacturing Jobs — The U.S. economy added manufacturing jobs every month during Trump’s first 18 months in office. But those job gains began to erode — beginning in March 2019, a year before the pandemic — and took a deep dive as the virus crisis forced a wave of plant closings.
Nearly 1.4 million manufacturing jobs were lost in March and April 2020. When Trump left office, there were 154,000 fewer people employed in manufacturing than when he became president. That followed a net decrease of 194,000 under Obama.
Economic Growth
Even before the COVID-19 pandemic, the U.S. economy began slowing down. The real (inflation-adjusted) gross domestic product went up in Trump’s first two years, peaking at an estimated 2.9% in 2018 — the highest since 2005. But the economy grew only 2.3% in 2019 and the bottom fell out in 2020.
The real GDP declined 3.4% in 2020 from the previous year. It was the largest drop since 1947, when the nation’s economy declined 11.6% after years of economic expansion fueled by World War II.
As a candidate and president, Trump promised the nation’s economy would grow on an annual basis by 4% to 6%. But it never topped 3%.
Income and Poverty
Household Income — Household income rose briskly under Trump before declining last year due to the pandemic.
The Census Bureau’s latest report on “Income and Poverty in the United States,” which was released Sept. 14, showed that median household income reached $67,521 in 2020 — a 2.9% decrease from 2019 but an increase of $3,838 from 2016 when adjusted for inflation. That’s an increase in median household income of 6% during Trump’s four years. (The median is the midpoint — half of all households earned more, half less.)
However, a Census statistician told FactCheck.org that the bureau, in the next couple of months, will publish work that accounts for survey nonresponse due to the pandemic, which could change the 2020 income estimates.
In addition, Census officials have said that some caution should be exercised when making comparisons to estimates prior to 2017, since recent estimates reflect improvements made to the Current Population Survey Annual Social and Economic Supplement in 2014 and 2019. The bureau previously published adjusted estimates showing what median household income would have been for past years, had the current questionnaire and processing procedures been in place.
On that adjusted basis, the increase during Trump’s four years would be slightly higher — $4,083, or 6.4%, in 2020 dollars.
Poverty — As incomes decreased, the official poverty rate increased about 1% from 2019. It was at 11.4% in 2020, up from 10.5% in 2019. It was the first increase in the official poverty rate after five consecutive years of declines, dropping 1.3 percentage points in 2015, 0.8 points in 2016, 0.4 points and 0.5 points in Trump’s first two years, and 1.3 points in 2019.
In 2020, there were 37.2 million people in poverty, nearly 3.3 million more than in 2019.
Overall, since 2016, the year before Trump took office, the poverty rate dropped by 1.3 percentage points, and the number of people in poverty went down by 3.4 million.
The official poverty rate, however, does not include government programs that benefit low-income families and individuals — such as housing assistance and food stamps — that were expanded in COVID-19 relief bills that became law last year. The Census Bureau measures the impact of these programs using the Supplemental Poverty Measure, which it began publishing in 2011.
The supplemental poverty rate fell significantly last year, from 11.8% in 2019 to 9.1% in 2020 — “the lowest rate since estimates were initially published for 2009,” Census said in a Sept. 14 report.
“Stimulus payments, enacted as part of economic relief legislation related to the COVID-19 pandemic, moved 11.7 million individuals out of poverty. Unemployment insurance benefits, also expanded during 2020, prevented 5.5 million individuals from falling into poverty,” the bureau said.
Under Trump, the overall supplemental poverty rate fell nearly 5 percentage points, from 14% in 2016 to a record low 9.1%, and the number of people in poverty fell by nearly 15 million.
Regulations
The growth of federal regulation slowed to a crawl under Trump.
The number of restrictive words and phrases (such as “shall,” “prohibited” or “may not”) contained in the Code of Federal Regulations stayed below 1.08 million for most of 2019— a little below where it was when Trump took office. But as of the day he left office, the count had crept up to just under 1.09 million — an increase of 10,141 (or 0.9%) since Trump’s inauguration.
That small increase during Trump’s four years is a big departure from the past, when restrictions grew 12.3% during Bush’s eight years and by 12.5% during Obama’s eight years, according to annual figures from the QuantGov tracking project at George Mason University’s Mercatus Center.
That slowdown under Trump may be temporary, however.
In what it called “the largest deregulatory initiative of this administration,” the Trump administration issued a final rule that nullified Obama-era fuel economy standards for new cars and light trucks. Trump’s rule requires them to maintain an average efficiency of 40.4 miles per gallon by model year 2025, down from the 46.7 mpg set under Obama. But now the Biden administration is proposing new rules that it estimates will result in average efficiency of 48 mpg by model year 2026.
Crime
Murders and aggravated assaults shot up dramatically under Trump, while most other types of crime declined.
In his inaugural address, Trump darkly portrayed America as a country mired in poverty, drugs and crime. “This American carnage stops right here and stops right now,” he promised. But quite the contrary, the FBI’s annual Crime in the United States report, released Sept. 27, shows 4,157 more homicides were committed in 2020 than in 2016, when Trump was elected. (See Table 1.)
That translates to a murder rate per 100,000 people of 6.5 in 2020, an increase of 1.1 points since 2016. The 2020 rate was the highest since 1997, though still well below the peak 10.2 rate recorded in 1980.
The rate of aggravated assaults also rose under Trump — by 12.6%.
However, the rate of reported rapes declined by 6.1%, and the rate of robberies went down 28.2%. The burglary rate dropped 33%, and the rate of larcenies and thefts went down 19.9%, while the rate of motor vehicle thefts edged up a scant 3.7%.
The big jump in the number of murders is entirely due to a 29% rise in Trump’s final year, which also saw millions laid off from jobs due to the COVID-19 pandemic; widespread protests against racism and police brutality following a Minneapolis policeman’s murder of a black man, George Floyd; and a surge in production and sales of firearms.
Guns
Sales and production of guns slowed during Trump’s presidency — until COVID-19 concerns and protests against policing triggered huge spikes last year.
Handgun Production — In 2020, the annual production of pistols and revolvers in the U.S. set a new record of 6.3 million, according to interim figures from the Bureau of Alcohol, Tobacco, Firearms and Explosives.
That represented a 75% spike from last year and an increase of 12.5% from 2016, when production surged to a previous record high of nearly 5.6 million.
Gun Sales — Gun sales also slowed during Trump’s presidency — until last year.
The government doesn’t collect data on gun sales. But the National Shooting Sports Foundation — the gun industry’s trade group — estimates gun sales by tracking the number of background checks for firearm sales based on the FBI’s National Instant Background Check System, or NICS. The NSSF-adjusted figures exclude background checks unrelated to sales, such as those required for concealed-carry permits.
The NSSF-adjusted figure for the sales of firearms in Obama’s final year reached a then-record high of 15.7 million. Gun sales didn’t approach that level in each of Trump’s first three years. But, in Trump’s last year in office in 2020, firearm sales set a new high of nearly 21.1 million.
The NSSF-adjusted figures are only an approximation of actual sales, since some of these checks cover purchases of multiple weapons, and of course some sales still occur without background checks.
Border Security
Illegal border crossings, as measured by apprehensions at the Southwest border, were 14.7% higher in Trump’s final year in office compared with the last full year before he was sworn in.
That’s how we’ve been calculating this statistic going back to our “Numbers” articles for Obama.
Although Trump boasted during a speech in Alamo, Texas, just a week before he left office that “we reformed our immigration system and achieved the most secure southern border in U.S. history,” the number of apprehensions for illegal border crossings was higher during Trump’s presidency than either of Obama’s four-year terms.
But these statistics tell only part of the story. The number of apprehensions fluctuated wildly during Trump’s presidency, from a monthly low of 11,127 in April 2017 to a high of 132,859 in May 2019.
After constant talk on the campaign trail about building a wall and cracking down on illegal immigration, the number of apprehensions plummeted in the immediate months after Trump’s inauguration — “what became known as the Trump Effect,” Jessica Bolter, an associate policy analyst at the Migration Policy Institute, told us. The monthly low of 11,127 in April 2017 is unmatched in Customs and Border Protection records going back to 2000.
But the numbers crept back up in late 2017 and early 2018. There was another small dip after the so-called zero tolerance policy was initiated in mid-2018, Bolter said. Trump administration policy required the Department of Homeland Security to refer all adults who illegally entered the U.S. for criminal prosecution. That resulted in children being separated from their parents, who entered the federal court system and were placed in detention centers for adults only. But after Trump signed an executive order ending the policy, apprehensions again rose, Bolter said.
The number of apprehensions peaked in mid-2019, and the year ended with the highest number of apprehensions since 2007. In response, Trump issued several policies to reduce immigration flows, including measures to restrict eligibility for asylum and return non-Mexican asylum seekers who cross the Southwest border to Mexico while their claims work their way through immigration courts (the so-called “Remain in Mexico” program). Correspondingly, apprehensions dropped steadily through the second half of 2019 and into 2020.
And then, when the pandemic hit, apprehensions dropped even more dramatically in April and May 2020. As a result of the pandemic, there was an increased restriction on mobility, not just in the U.S. but around the world, Bolter said.
In response to the pandemic, Trump put into place a series of policies aimed at blocking migration to the U.S., including one that allowed border patrol to quickly expel any illegal immigrants they stopped, without access to the appeals system.
While the policy may have deterred families with children from crossing, it served as an incentive for single adults to attempt illegal crossings, multiple times if necessary, Bolter told us. And so there was an increase in apprehensions in the second half of 2020.
Trump didn’t fulfill the signature promise of his 2016 campaign — to build a 1,000-mile-long wall along the Southwest border. Nonetheless, a substantial amount of fencing was constructed.
In total, 458 miles of “border wall system” was built during the Trump administration, according to a CBP status report on Jan. 22, 2021. Most of that, 373 miles of it, is replacement for primary or secondary fencing that was dilapidated or outdated. In addition, 52 miles of new primary wall and 33 miles of secondary wall were built in locations where there were no barriers before.
Since the land border itself is 1,954 miles long, according to the US-Mexico International Boundary and Water Commission, the new fencing constructed under Trump covers just over 20% of the Southwest border. Together with what existed before Trump took office, there are now about 706 miles of barriers, about 36% of the total Southwest border.
Corporate Profits
After-tax corporate profits set new records in the first two years of Trump’s presidency — but declined slightly in 2019 and fell further still in 2020, when the pandemic forced businesses to close, some permanently.
Still, after-tax corporate profits were higher when Trump left office than when he arrived.
Corporate profits hit a record $1.98 trillion in 2018 (see line 45), up from the previous record of $1.88 trillion set in 2017. Profits dipped in 2019 ($1.95 trillion) and again in 2020 ($1.91 trillion).
Despite the two-year decline, after-tax corporate profits were 8.5% higher last year than they were in 2016, the year before Trump’s inauguration.
An April study by economists at the Federal Reserve estimated that from March 2020 through February 2021 the “excess establishment exit” — that is, permanent closures beyond what would otherwise have been expected — was below 200,000 establishments. That implies “an exit rate about one-quarter to one-third above normal,” the study said.
While many of those closures would involve small businesses that are not corporations, the figures give some indication of the economic impact of the pandemic.
Stock Market
After a pandemic-induced plunge in stock prices in March 2020 ended a decade-long bull market, the stock market quickly recovered and set new record highs.
On Jan. 19, 2021, the Standard & Poor’s 500-stock average closed at 67.8% above where it had been the day before Trump was inaugurated in 2017.
The Dow Jones Industrial Average, made up of 30 large corporations, was up 56.7% during Trump’s time in office.
And the NASDAQ composite index, made up of more than 3,000 companies including many in the technology sector, more than doubled under Trump — up 138.2% since he took office.
These gains came after sizable increases in the market under Obama, when the S&P rose 166% and the Dow Jones went up 138% over his eight years, after the 2007-2009 financial crisis.
Wages and Inflation
During Trump’s four years in office, wages went up and inflation remained in check.
CPI — The Consumer Price Index rose 7.6% under Trump — continuing a long period of low inflation that appears to be coming to an end under Biden, as supply chain problems and other factors drive up costs.
The CPI rose an average of 1.9% each year of the Trump presidency (measured as the 12-month change ending each January), according to the Bureau of Labor Statistics. That was about the same as the average under Obama (1.8%) and below the average of 2.4% during each of George W. Bush’s years.
By contrast, CPI was up 5.3% in August compared to a year ago. Federal Reserve Chairman Jerome Powell said at a panel discussion in late September that he expected inflation pressures to continue into 2022.
Wages — Meanwhile, paychecks grew faster than prices during Trump’s tenure.
The average weekly earnings of all private-sector workers, in “real” (inflation-adjusted) terms, rose 8.7% in Trump’s four years. Wages for rank-and-file production and nonsupervisory workers — who make up 81% of all private-sector workers — went up 9.8% under Trump.
The gains extended a trend that started after the 2007-2009 recession. During the Obama years, real weekly earnings rose 4.2% for all workers, and 4% for rank-and-file.
Consumer Sentiment
Consumer confidence in the economy initially rose under Trump, who promised during the campaign to “make our economy grow again.” But, like other economic measures, it fell during the pandemic.
The University of Michigan’s Surveys of Consumers monthly index was 87.2 in October 2016, a month before the 2016 presidential election, and 98.5 in January 2017, when Trump took office. Under Trump, the consumer confidence rate reached 100 or more five times — a level that it hadn’t reached during Obama’s eight years or any of the prior four years during Bush’s second term.
The rate under Trump peaked at 101.4 in March 2018 — the highest it had been since January 2004. It was at 101 in February 2020, a month before the pandemic shut down large parts of the economy. From there, the rate fell 11.9 points in March 2020 and plunged another 17.3 points in April 2020, when the rate dropped to 71.8 — its lowest level during the Trump presidency.
When Trump left office, the preliminary figure for January 2021 was 79 — 8.2 points lower than where it was in October 2016, just before Trump was elected, and 19.5 points lower than where it stood when he took office in January 2017.
Home Prices
Home prices set annual records in each of Trump’s four years in office.
The national median price of an existing, single-family home was $300,200 last year, according to seasonally adjusted annual sales figures from the National Association of Realtors. That’s 27.5% higher than it was in 2016, when the median price was $235,500.
Much of the rise has taken place since the pandemic hit. Existing single-family home prices jumped 12.9% from February 2020 to January 2021. Experts attribute the higher prices to high demand, supply shortages and record-low mortgage rates.
The Realtors’ figures reflect raw sales prices without accounting for inflation. But home prices far outstripped inflation during Trump’s tenure. The Consumer Price Index rose only 7.6% during that same period.
Homeownership
The percentage of Americans who own their homes continued to recover under Trump, but it has yet to return to the highs of 2004.
The homeownership rate, which the Census Bureau measures as the percentage of housing units that are owner-occupied, peaked at 69.2% for two quarters in 2004. From there, the rate steadily fell for more than a decade, and tied for the lowest on record in the second quarter of 2016 at 62.9%. (Census Bureau homeownership rates date to 1965, when the rate was 62.9% for the first nine months of that year.)
The rate recovered 0.8 points in Obama’s last six months, and the trend generally continued over the last four years. In Trump’s last quarter in office, the homeownership rate reached 65.8% — 2.1 points higher than it was when he took office.
The Census Bureau, however, urged data users to “exercise caution when comparing the second, third, and fourth quarter 2020 estimates” to previous quarters because of the pandemic and changes in data collection caused by the pandemic. Census said it suspended in-person data collection in March 2020, because of the spread of the coronavirus.
Trade
The international trade deficit Trump once promised to reduce grew larger instead, increasing three out of his four years in office.
The most recent government figures show that the total U.S. trade deficit in goods and services in 2020 was almost $677 billion — the highest since 2008 and an increase of 40.5% from 2016.
Annual exports of goods and services decreased 4.6% in 2020 compared with 2016. Meanwhile, annual imports of goods and services were up 3.4% in 2020 compared with four years earlier.
Trump’s record with several key trading partners was a mixed bag.
China — A
Canada — Tpan>rump inherited an almost $11 billion goods-and-services trade surplus with Canada, which later became a $261 million annual deficit in 2019. While it rebounded to a $4.6 billion surplus in 2020, that figure was 57% lower than it was in 2016.
Mexico — >The annual goods-and-services trade deficit with Mexico steadily increased throughout Trump’s four-year presidency. As of 2020, it was up to $112 billion, which was 75% higher than the roughly $64 billion deficit in 2016.
Health Insurance Coverage
The number of people lacking health insurance rose by 3 million under Trump.
The U.S. Census Bureau reported Sept. 14 that the number of Americans who lacked health insurance for all of 2020 was 28 million — up from 25.1 million in 2016. That’s an increase of 2.9 million.
The percentage of Americans without coverage for all of 2020 rose to 8.6%, from 7.9% in 2016.
During Trump’s tenure, the number of uninsured Americans rose for the first time in a decade in 2018.
(A technical note: Due to changes in survey methods, the latest Census report says that 2018 and later estimates can be compared with 2016 estimates from a research file, available here.)
The Census report matches a trend measured on a more frequent and timely basis by the National Health Interview Survey. The NHIS put the number of people who lacked coverage at the time they were interviewed — not necessarily for the entire year — at 31.6 million in 2020, an increase of 3 million over 2016.
The NHIS said 9.7% of the population lacked coverage at the time of interview in 2020, up from 9% in 2016.
Trump failed to “repeal and replace” the Affordable Care Act as he promised to do, but his administration did slash advertising and outreach aimed at enrolling people in Obamacare plans. In December 2017, he signed a tax bill that ended the ACA’s tax penalty for people who fail to obtain coverage, effective in 2019. And in March 2019 the Trump administration joined an effort by GOP state attorneys general seeking a court decision to overturn the entire act. Ultimately, the Supreme Court ruled the plaintiffs in that case lacked standing, meaning they did not demonstrate “an injury ‘fairly traceable’ to the ‘allegedly unlawful conduct,’” the court said in its opinion.
Food Stamps
Trump trimmed the rolls of food-stamp recipients, but only modestly.
The number getting food stamps (now known as Supplemental Nutrition Assistance) rose by 14.7 million under George W. Bush and by another 10.7 million under Obama, but fell back only 738,469 by the end of Trump’s time in office. That’s a decline of 1.7% under Trump.
Trump had attempted to cut the number of recipients even further, for example, by tightening work requirements for able-bodied adults without dependents. And indeed the total number of recipients dipped below 36.9 million in February 2020. But then the COVID-19 pandemic forced 22 million out of work.
Trump then reversed course. He signed a bipartisan emergency relief bill that (among other things) both suspended the new work requirement rule temporarily and made families eligible for food stamps if their children had received free or reduced-cost meals at schools that were then closed.
During his last month in office, nearly 42 million Americans were still receiving the food aid. That’s about 12.5% of the population, or 1 out of 8 Americans.
Judiciary Appointments
In one term, Trump’s nominees filled one-third of the Supreme Court, nearly 30% of the appellate court seats and a quarter of District Court seats.
Supreme Court — Trump won Senate confirmation for three Supreme Court nominees, Justice Neil M. Gorsuch, Justice Brett M. Kavanaugh and Justice Amy Coney Barrett, who was confirmed in late October by the Republican-led Senate, about a week before the Nov. 3 election. Trump filled one-third of all seats on the high court during his term.
Obama was able to fill only two high court vacancies during his first term (and as it turned out, during his entire eight years in office) — with Justice Sonia Sotomayor and Justice Elena Kagan.
Court of Appeals — Trump also won confirmation of 54 U.S. Court of Appeals judges (30 during his first two years and another 24 in his last two years). That’s far more than the total for Obama in his first term, when he won confirmation for 30 judges (16 during his first two years and 14 more in the subsequent two years). And Trump’s total is just one shy of the 55 confirmations Obama achieved over eight years.
Trump installed nearly 30% of all the 179 appellate court judges authorized by federal law.
District Court — Trump won confirmation for 175 of his nominees to be federal District Court judges.
That’s nearly 26% of the 677 authorized district judges. Obama won confirmation for 143 in his first term and 127 in his second.
Trump also filled 10 seats on the U.S. Court of Federal Claims, which has nationwide jurisdiction over lawsuits seeking money from the government. And he filled three seats on the U.S. Court for International Trade. Obama filled four seats on the Court for International Trade and no seats on the Court of Federal Claims during his eight years in office.
Trump must share responsibility for this record with Republicans in the Senate.
The Republican-majority Senate not only refused to consider Obama’s appointment of Merrick Garland to fill the Supreme Court vacancy eventually filled by Gorsuch, but they also blocked confirmation of dozens of Obama’s nominees to lower courts. Trump inherited 17 Court of Appeals vacancies, for example, including seven that had Obama nominees pending but never confirmed.
Debt and Deficits
The federal debt held by the public went up by half under Trump, and deficits also increased each fiscal year on his watch.
Debt — Trump made no progress in erasing the debt, which the then-presidential candidate once said he could probably do in eight years.
Rather, the amount the federal government has borrowed from the public went up by 50% during Trump’s time in office — from $14.4 trillion on the day he was inaugurated to $21.6 trillion the day his successor was sworn in.
Likewise, the debt as a percentage of the economy also grew under Trump, rising from 76.2% of GDP in fiscal year 2016 to 100.1% of GDP in fiscal year 2020, according to figures from the Office of Management and Budget.
Deficits — Trump left office almost four months after the U.S. recorded its largest annual deficit of $3.1 trillion in fiscal year 2020.
That historic shortfall was mostly the result of the coronavirus pandemic, which reduced government revenues and spurred massive government spending (and borrowing) to help the nation cope with the economic and public health challenges of the pandemic. But, prior to that, annual deficits had consistently risen under Trump, going from $585 billion in fiscal 2016 — the last full budget cycle before Trump’s presidency — to $984 billion in fiscal 2019.
In addition, as of January 2020, which preceded the March declaration of the pandemic, the nonpartisan Congressional Budget Office had projected that the deficit would reach $1 trillion in fiscal 2020 and average $1.3 trillion between fiscal years 2021 and 2030.
Then, three weeks after Trump was no longer president, CBO projected that, solely based on laws already in effect as of Jan. 12, the fiscal 2021 deficit would be $2.3 trillion. It continued to rise after Biden took office, as the new president and a Democratic-controlled Congress provided still more pandemic relief.
Coal and Environment
Coal Mining Jobs — As a candidate, Trump promised to “put our [coal] miners back to work,” but that didn’t happen.
There were 8,500 fewer coal mining jobs in January than when Trump took office. That’s a decline of 16.7%.
Even before the pandemic, coal mining jobs were on the decline under Trump. There were 50,900 coal mining jobs in January 2017, when Trump became president. But at the end of 2019, there were 47,700 such jobs — a decline of 3,200. The job losses continued in early 2020 and accelerated during the pandemic — dropping to a new low of 38,000 in April 2020.
The job losses continued a trend that began decades ago. In January 1985, there were 170,500 coal mining jobs, but the industry hasn’t had more than 100,000 jobs since January 1995. In Obama’s eight years, the industry lost 35,500 jobs, a decline of 41%.
U.S. coal production declined by 26.5% under Trump, from 728 million short tons in 2016 to 535 million short tons in 2020. Last year’s production was the lowest annual level since 1965. EIA expects U.S. coal production to increase 15% this year.
Carbon Emissions — Carbon dioxide emissions from energy consumption dropped sharply last year because of the global economic disruption caused by the COVID-19 pandemic. Emissions in the U.S. fell to 4.6 billion metric tons — the lowest level since 1983 and an 11.5% decrease from 2016, according to Energy Information Administration data.
But even before the pandemic, U.S. carbon emissions largely have been on the decline.
In a July report, the EIA said U.S. energy-related carbon dioxide emissions peaked at 6 billion metric tons in 2007 and fell to 5.1 billion by 2019 — a 14% drop. “This decline in emissions occurred even though U.S. real GDP grew by 22% during the same period,” the EIA report said.
The EIA attributed the decline to numerous factors, including cheaper natural gas, an expansion of clean energy capacity, and improved energy efficiency of buildings, vehicles and equipment.
Under Trump, annual emissions rose once in four years, when they increased by 2.8% in 2018. The following year, in 2019, CO2 emissions fell 2.6% before dropping sharply during the pandemic last year.
EIA expects CO2 emissions to increase by about 7% in the U.S. this year as the economy improves and travel increases.
Oil Production and Imports
The increase in crude oil production that began under Obama continued under Trump, soaring to new record highs before COVID-19 contributed to a decline in 2020.
The 4.1 billion barrels produced last year were still more than in any year other than 2019, when nearly 4.5 billion barrels were produced, according to the Energy Information Administration. Even with the down year, crude oil production was up 27.6% in 2020 compared with 2016.
Increased domestic production under Trump led to fewer annual crude oil imports, which were down 25% in 2020 from four years earlier. The total number of imported crude oil barrels in 2020 — 2.15 billion — was the lowest total since 1991.
However, while the U.S. again became a net exporter of petroleum products last year, it remained a net importer of crude oil, specifically, the EIA said.
Editor’s note: In January, we plan to publish our first quarterly report on President Joe Biden.