No global warming/climate change according to NOAA? Cite it.+3/-1
Author:TheCrow 2/7/2023 4:05:22 PM
Reply to: 2764488
"Have we been wasting a lot of dollars on global warming, destroyed a lot of our economy and businesses when there is not any?
"National Oceanic and Atmospheric Administration has reported there has been NO global warming for the eighth year in a row."
Cite the source substantiating that. It doesn't appear at the NOAA site.
Are you contending that no global warming/climate change was reported for the eighth year in a row. Cite that. When I reviewed their site, it reported unusually warm temperatures world wide:
The year 2022 was the sixth warmest year since global records began in 1880 at 0.86°C (1.55°F) above the 20th century average of 13.9°C (57.0°F). This value is 0.13°C (0.23°F) less than the record set in 2016 and it is only 0.02°C (0.04°F) higher than the last year's (2021) value, which now ranks as the seventh highest. The 10 warmest years in the 143-year record have all occurred since 2010, with the last nine years (2014–2022) ranking as the nine warmest years on record. Of note, the year 2005, which was the first year to set a new global temperature record in the 21st century, currently ties with 2013 as the 11th-warmest year on record. The year 2010, which had surpassed 2005 at the time, now ranks as the 10th-warmest year on record.
As I have posted before, there is some question of the global warming being solely caused by human activity versus natural CO2 emissions which are cyclic to some extent. No matter which is ultimately responsible, it is wise to minimize humanities' contribution to the climate change. If it is the cause, then we could conceivably stabilize the process if not actually reversing it. If anthropomorphic CO2 is not the sole cause, then reducing still makes sense.
Are efforts to minimize climate change damaging our economy? Perhaps those parts of the economy that are being adversely affected are those that contribute most to climate change? Perhaps those industries should change to less problematic methods of producing whatever.
Burning fossil fuels like gasoline and diesel releases carbon dioxide, a greenhouse gas, into the atmosphere. The buildup of carbon dioxide (CO2) and other greenhouse gases like methane (CH4), nitrous oxide (N2O), and hydrofluorocarbons (HFCs) is causing the Earth’s atmosphere to warm, resulting in changes to the climate we are already starting to see today.
Greenhouse gas (GHG) emissions from transportation account for about 27 percent of total U.S. greenhouse gas emissions, making it the largest contributor of U.S. GHG emissions. Between 1990 and 2020, GHG emissions in the transportation sector increased more in absolute terms than any other sector.
Fully electric, hybrid and plug in hybrid reduce emissions, even considering that the plants generating electricity are greenhouse gas emitters. The largest single greenhouse gas emitter is an electricity generating plant in Georgia- Plant Scherer.
The researchers found that, on average, gasoline cars emit more than 350 grams of CO2 per mile driven over their lifetimes. The hybrid and plug-in hybrid versions, meanwhile, scored at around 260 grams per mile of carbon dioxide, while the fully battery-electric vehicle created just 200 grams.
That quote considers total greenhouse gases from production, to power generation to 'tailpipe emissions'. Reducing "... gasoline cars emit more than 350 grams of CO2 per mile driven over their lifetimes" to "hybrid and plug-in hybrid versions, meanwhile, scored at around 260 grams per mile of carbon dioxide, while the fully battery-electric vehicle created just 200 grams". That reduces CO2 emissions by nearly half, a 44.44% reduction; and "... while the fully battery-electric vehicle created just 200 grams" reduced CO2 by 25% from that of hybrid/plug-in hybrid.
Posted on January 26, 2023 | Corrected on January 27, 2023
THIS ARTICLE IS AVAILABLE IN BOTH ENGLISH AND ESPAÑOL
SciCheck Digest
The warming trend in global temperature continued in 2022, which was the sixth-warmest year on record, according to a recent report from the National Oceanic and Atmospheric Administration. But a viral tweet — using just a small segment of a NOAA graph — wrongly claimed the agency had announced a “global cooling” trend.
Full Story
The sixth-warmest year on record was in 2022, the National Oceanic and Atmospheric Administration reported on Jan. 12.
NOAA had released highlights from its most recent annual global climate report showing the planet’s average land and ocean surface temperature was 1.55 degrees Fahrenheit higher in 2022 than the 20th century average, which was 57 degrees F. This rise in temperature is part of an upward trend going back decades.
But Steve Milloy, who is on the board of a think tank that publishes content denying the existence of climate change, claimed “NOAA makes it official” that the “last 8 years” of temperature data show a “global cooling” trend.
That’s wrong. NOAA actually said the opposite.
“The planet continued its warming trend in 2022,” the agency’s press release said, “with last year ranking as the sixth-warmest year on record since 1880.”
But Milloy twisted the agency’s finding by copying and sharing a small portion of one of the graphs included in the release.
Graphic from the National Oceanic and Atmospheric Administration’s Jan. 12 press release.
In a Twitter post that received more than 13 million views, Milloy shared an image showing the tail end of a much larger bar graph and misinterpreting what the larger graph showed. He included just the last eight years of the bar graph that, in its entirety, showed how global temperatures compared to the 20th century average for the last 47 years (shown at right).
In the full report, NOAA included another graph showing the same data, but going back even further — 143 years, to 1880, when records began. That graph shows an even starker change.
“The 10 warmest years in the 143-year record have all occurred since 2010, with the last nine years (2014–2022) ranking as the nine warmest years on record,” the report says.
But, as we said, Milloy claimed that this data from NOAA showed that “CO2 warming is a hoax” by showing data for only the last eight years.
Understanding Fluctuations in the Climate
“I can’t believe this old canard is back,” Gabriel Vecchi, professor of geosciences at Princeton University and director of the High Meadows Environmental Institute, told FactCheck.org in an email.
“Multi-year periods of flat (or slightly negative) temperature changes are to be expected in a warming world,” he said, citing a 2016 paper that explained a warming slowdown in the early 2000s.
Vecchi highlighted some of the findings from the full NOAA report, including:
Every year since 2015 has been warmer than any year from 1880 to 2014.
Every year so far in the 21st century has been warmer than every year between 1880 and 2000 (except for 1998, which included a strong El Niño — more on that later).
As the graph showed, every year since 1977 has been warmer than the average for the 20th century.
Graph from NOAA’s 2022 global climate report showing annual temperatures compared to the 20th century average.
“The planet has warmed and is warm,” he said, noting that the Intergovernmental Panel on Climate Change has repeatedly found that the peer-reviewed literature on climate science indicates that “one cannot explain the warming over the past century in the absence of human-induced increases in atmospheric greenhouse gases (CO2, methane, etc).”
Showing only the last eight years of temperature change is, Vecchi said, “at best, irrelevant for assessing the reality of global warming.”
But, he said, “I think that the Tweet actually obfuscates and misleads.” Showing only the last eight years to suggest that warming has slowed or reversed doesn’t account for how the climate system works, he explained. For example, it takes out of context the impact of phenomena like El Niño and La Niña, climate patterns that develop in the Pacific Ocean roughly every two to seven years and affect global weather.
Graph from NOAA’s 2022 global climate report showing global temperatures compared to the 20th century average with El Niño and La Niña months highlighted.
“It is well-understood that fluctuations in the climate system, like El Niño and La Niña events can cause temporary periods of surface warming and cooling (respectively), due to the redistribution of warm ocean waters in the tropics and their impacts [on] the atmosphere and clouds,” Vecchi said, citing a 2009 paper that removed the effects of events such as El Niño and volcanic eruptions from the temperature record and found “a nearly monotonic global warming pattern since ∼1950.”
So, Vecchi said, “we expect that as the planet warms in response to increasing greenhouse gases, there should be multi-year periods in which the warming appears to accelerate and others in which [it] appears to slow down – and if one picks precisely the right years, one can find periods where there are temporary nominally negative trends.”
That appears to be the case for the eight years that Milloy selected. An El Niño in 2015 and 2016 resulted in surface warming, followed by La Niña in 2020 through 2022, which led to surface cooling.
“The role of the Pacific in driving multidecadal swings in global temperatures is understood well now,” Vecchi said. “If a big El Niño precedes a sequence of La Niña events, then one should expect to see a reduced (and potentially absent) rate of global warming over that period.”
So, presenting only the last eight years of climate data out of the context of the longer-term trend — and without explaining that timespan included, first, a warming period due to El Niño and then a cooling period due to La Niña — is deceptive.
Correction, Jan. 27: Every year so far in the 21st century has been warmer than every year between 1880 and 2000, except for 1998. We had omitted the exception in the original story.
Author:oldguy 2/7/2023 5:23:54 PM
Reply to: 2764504
Reading your post, it still says that the data for the last 8 years has No increase in the temperature. My link did not twist data, it just goes back 8 years! I suspect the most accurate temp readings.
I'll repost the pertinent points in my post for you:+3/-1
Author:TheCrow 2/7/2023 6:14:23 PM
Reply to: 2764510
I'll repost the pertinent points in my post for you:
The year 2022 was the sixth warmest year since global records began in 1880 at 0.86°C (1.55°F) above the 20th century average of 13.9°C (57.0°F). This value is 0.13°C (0.23°F) less than the record set in 2016 and it is only 0.02°C (0.04°F) higher than the last year's (2021) value, which now ranks as the seventh highest. The 10 warmest years in the 143-year record have all occurred since 2010, with the last nine years (2014–2022) ranking as the nine warmest years on record. Of note, the year 2005, which was the first year to set a new global temperature record in the 21st century, currently ties with 2013 as the 11th-warmest year on record. The year 2010, which had surpassed 2005 at the time, now ranks as the 10th-warmest year on record.
I don't know how you interpret the statement that "... the last nine years (2014–2022) ranking as the nine warmest years on record."
The last 8 years is definitely part of the last 10 years, and 2016 set the record high global temoperature and is definitely included in the last 8 years.
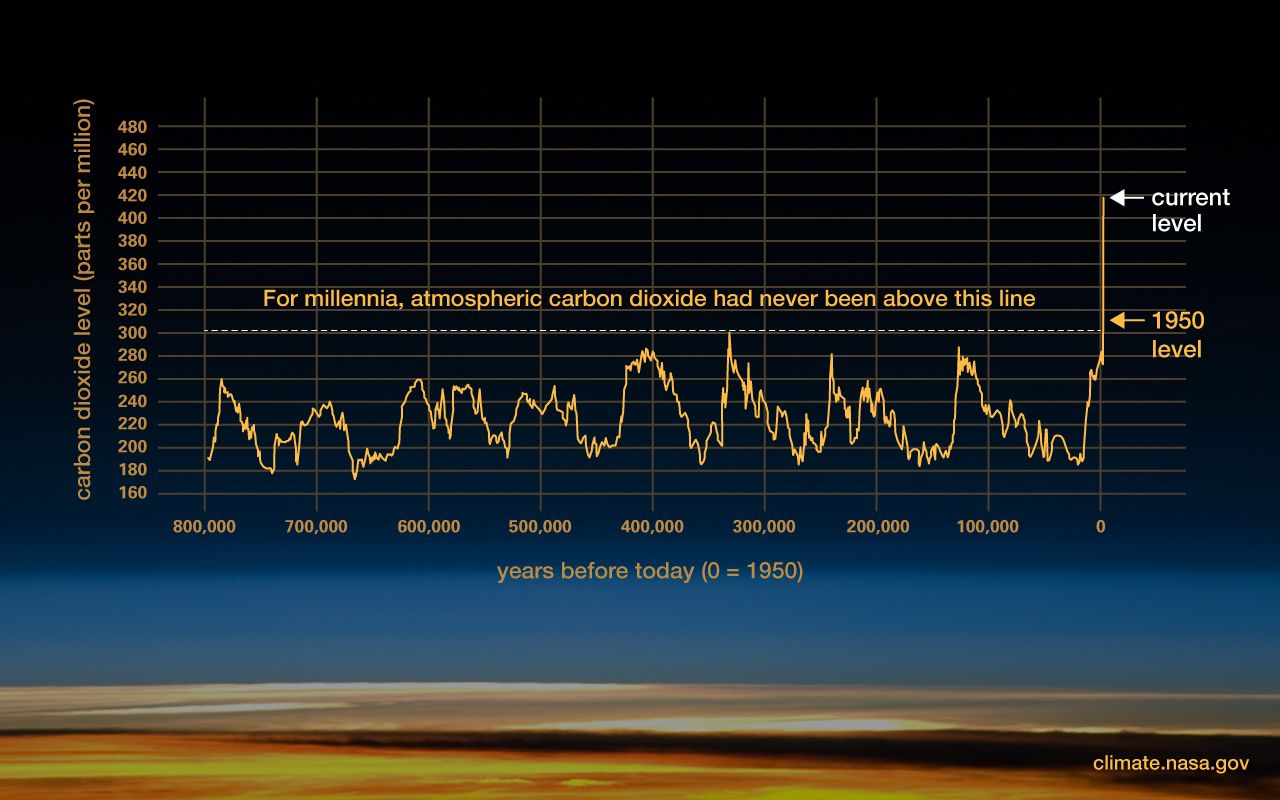
FYI, historic CO2 levels:
And Global temperatures showing increased temperatures with increased atmospheric CO2:
The correlation is obvious even if the cause is not definitely established as anthropomorphic. Whether or not that is so, it is still wise to be cautious and minimize the potential issue that humanity is the cause of increased CO2, etc. Analogy: you come upon an unknown pistol, so you treat it as if it was loaded until you know otherwise. We have not firmly established that the increased atmospheric CO2 is all man-made,but the effect is pretty clear and humanity is definitely contributing to the increase.
"I have wasted my time!" I love it! You deny validity of elections unless +3/-0
Author:TheCrow 2/7/2023 6:31:23 PM
Reply to: 2764510
"I have wasted my time!" I love it! You deny validity of elections unless the results are favorable. You deny science unless it, too, is favorable.
The science of global warming/climate change is clear in it's relationship to atmospheric CO2, which is supported by science, even if mankind is not the major contributor to the increasing atmospheric CO2 level.
As the economic costs of climate change escalate, so do the economic opportunities associated with climate action.
Summary:
Billion Dollar Losses, Trillion Dollar Threats: The Cost of Climate Change reviews the escalating toll of billion-dollar disasters over the last forty years and provides insight into how these disasters—from hurricanes and flooding to wildfires—are compounded by other extreme weather events, such as record-breaking drought, heat waves, and rainfall.
The trends identified in the report are concerning for America’s economy. Every state in the country has been impacted and faces risks from rapidly escalating weather and climate disaster damages, with a third of all losses since 1980 occurring in the last five years. From 2017-2021, America experienced its four most expensive wildfires, two of its three most expensive hurricanes, and its most expensive winter storm with economic losses from all disasters totaling $765 billion.
</div>
Findings
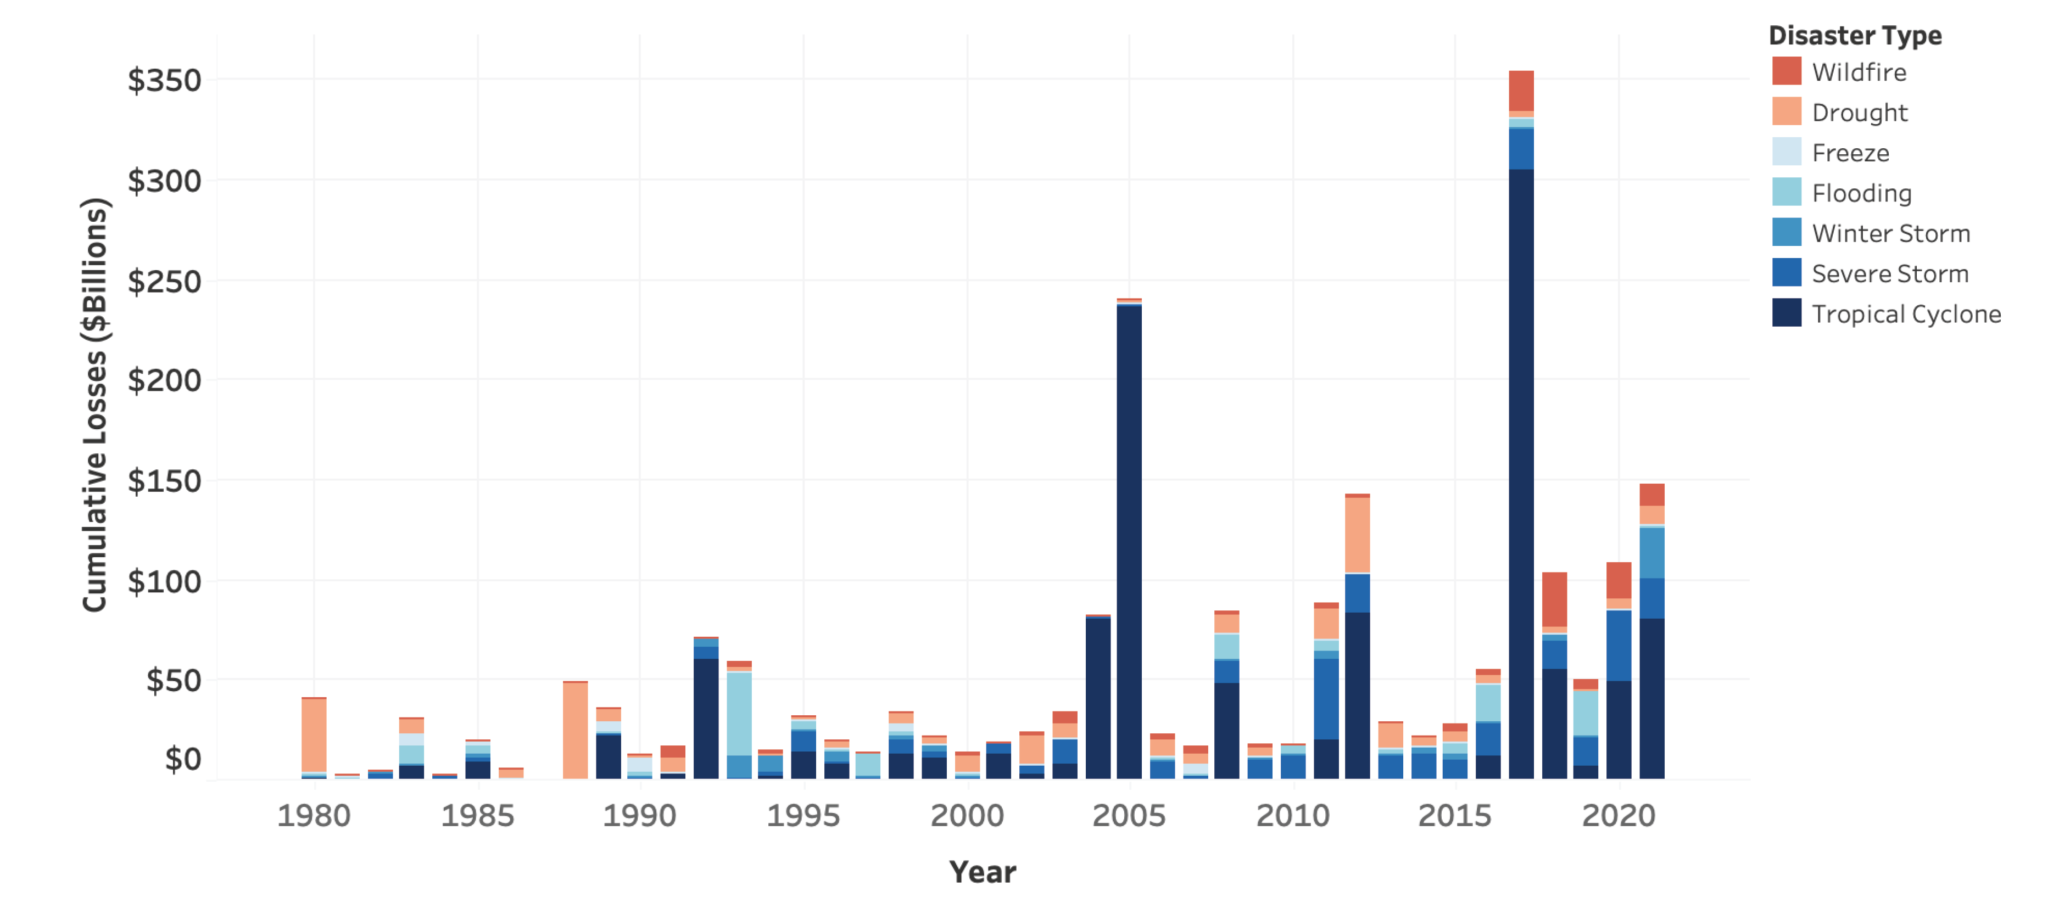
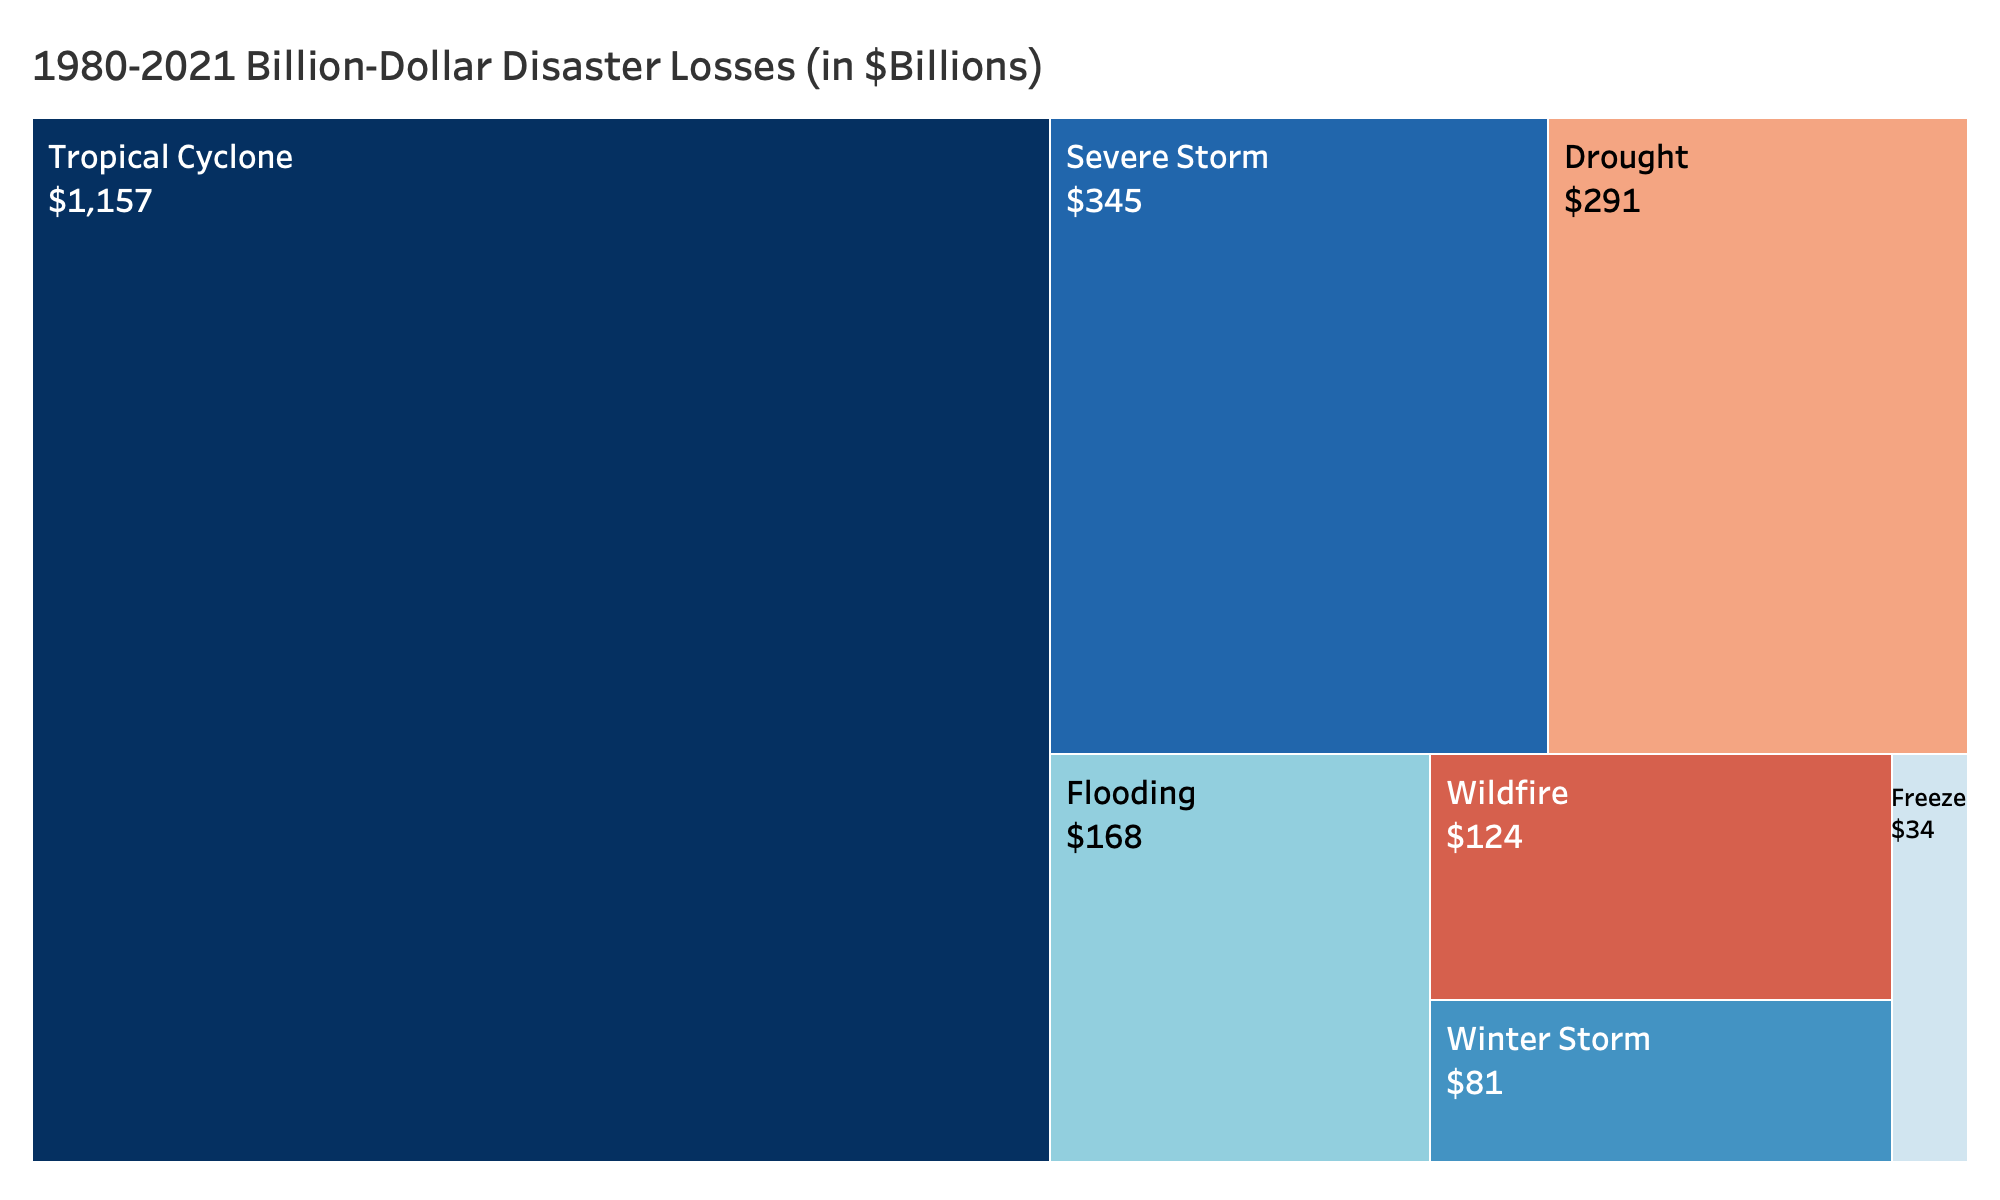
Billion-dollar weather and climate disasters in the form of hurricanes, severe storms, drought, flooding, wildfires, winter storms, and freezing have led to $2.2 trillion in losses since 1980 (see Figure 1) (NOAA, 2022). Across the United States, climate change is exacerbating extreme weather events and severely damaging infrastructure, buildings, roads, and cropland. Annual losses from billion-dollar disasters during the last five years—totalling $765 billion in losses and more than 4,500 deaths from 2017 to 2021—were nearly eight times higher than in the 1980s (NOAA, 2022). While billion-dollar disasters are responsible for an estimated 80 percent of total disaster-related losses, the combination of smaller disasters, heat waves, and ongoing business disruptions that are not captured mean the overall economic turmoil is even greater than this analysis details.
Climate change is not the sole driver of natural disasters, but it contributes to their frequency and severity. The world has warmed nearly 1.1 ˚C since 1880 (NASA, 2022), and warming is likely to exceed 1.5 ˚C in the near term, even with significant efforts to curb greenhouse gas emissions (Pörtner, 2022). Each year from 2001 through 2021 were among the 22 hottest years on record (NASA, 2022), and record-breaking temperatures led to a new high of 130 ˚F in Death Valley in 2021.1 These extreme weather events have widespread impacts: a recent analysis from the Washington Post estimated that in 2021 alone, a federal disaster emergency was declared in the home county of more than 40 percent of Americans (Kaplan et al., 2022).
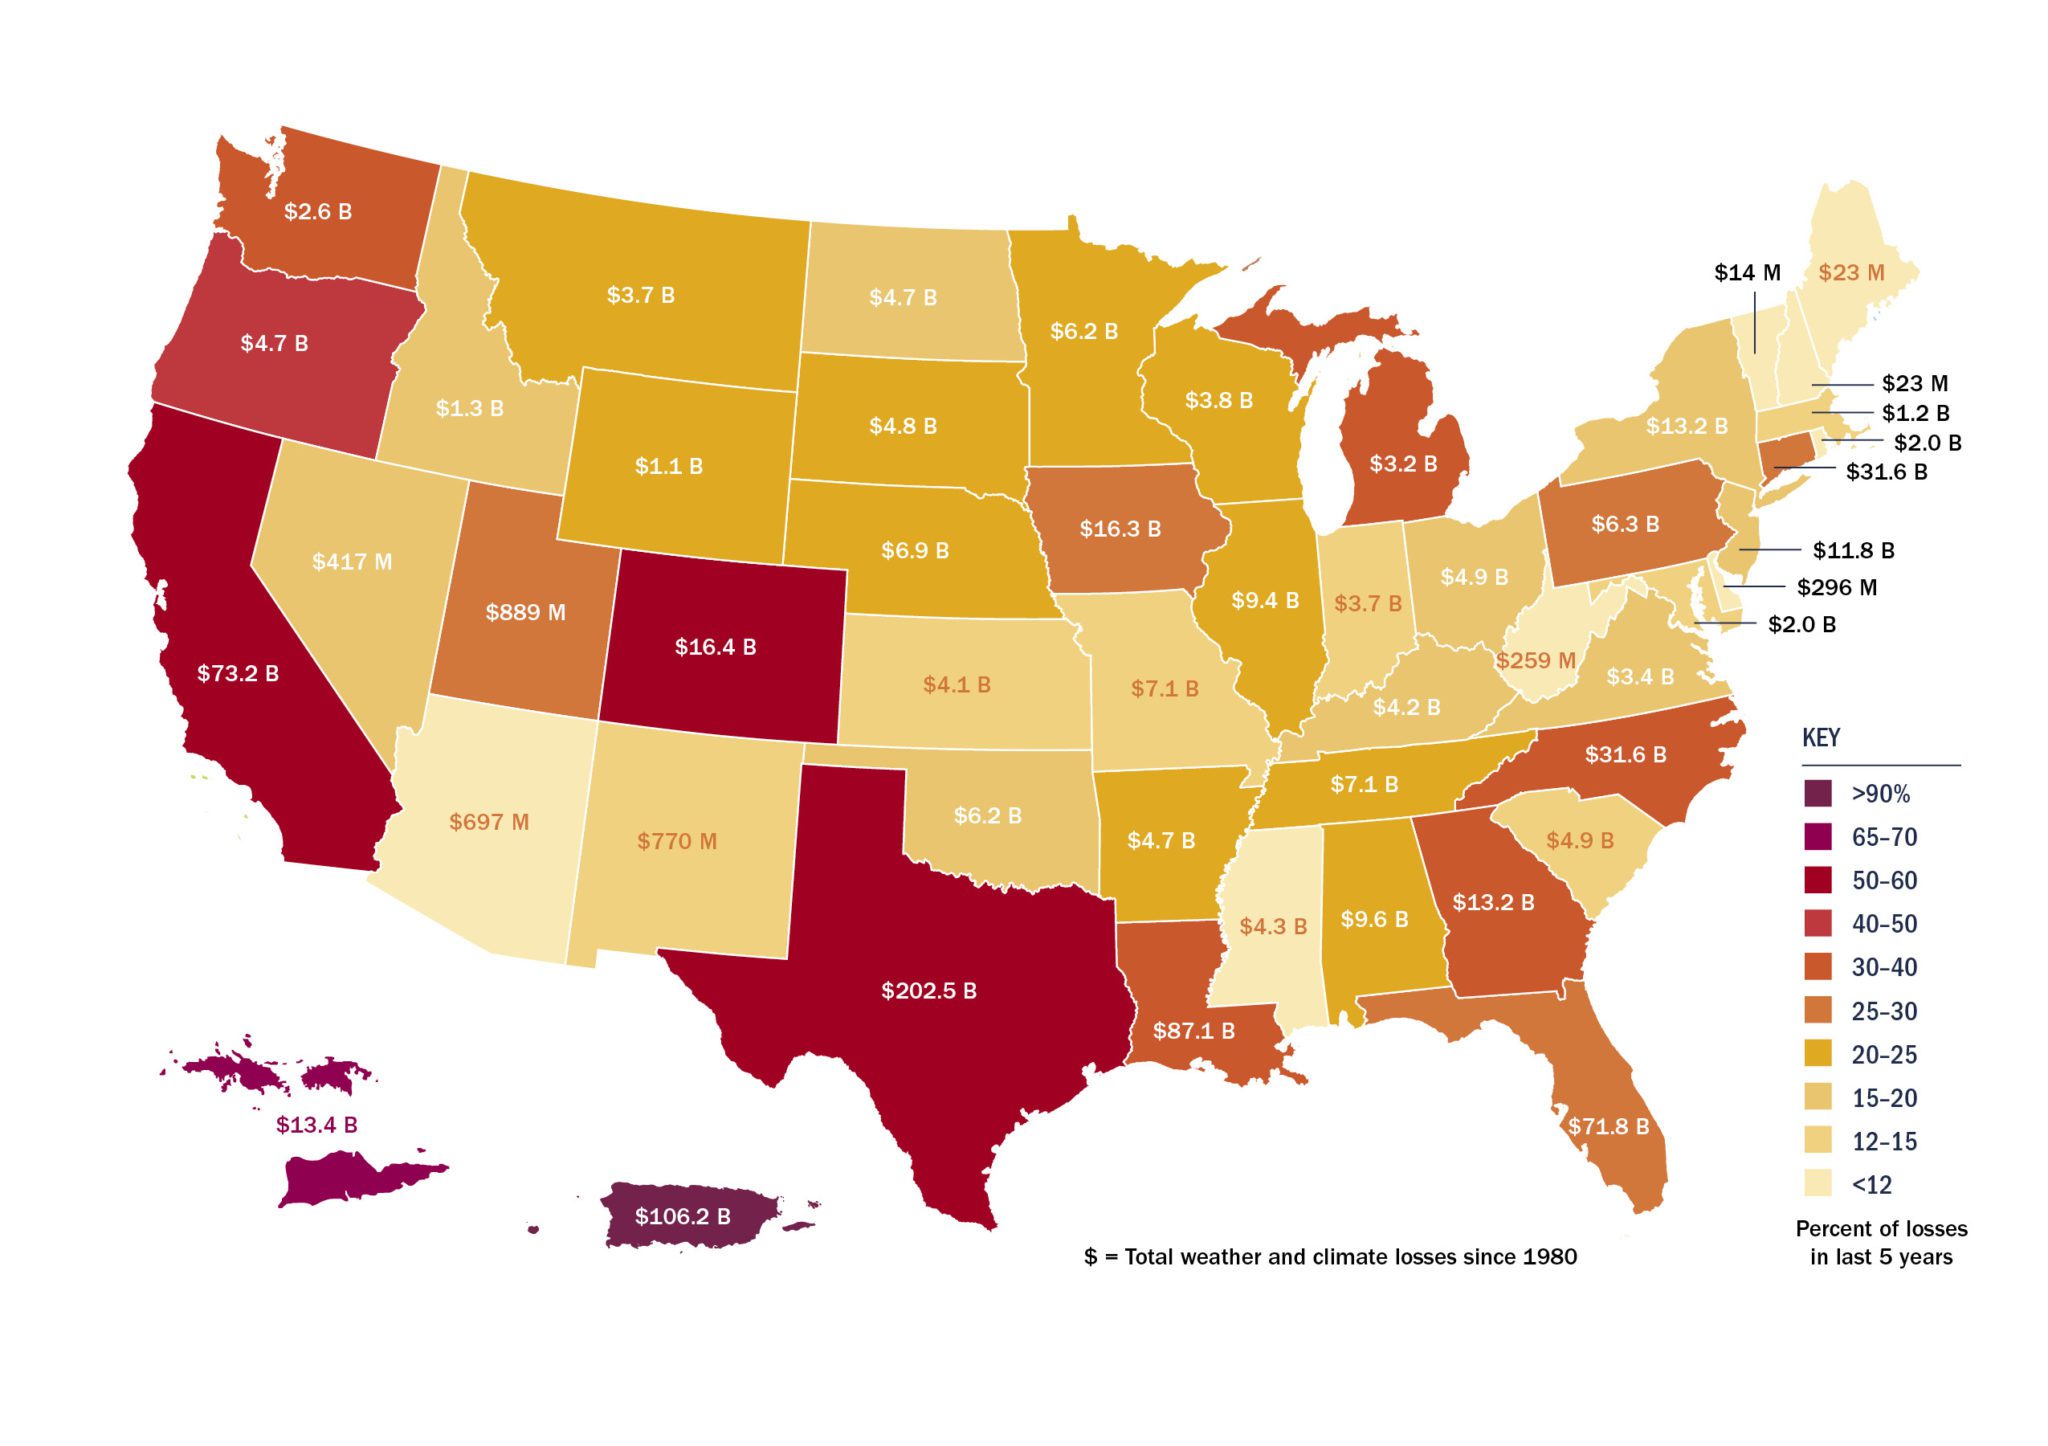
The frequency of climate-related disasters are rising, too. Between 2017 and 2021, the United States experienced its four most-expensive wildfires, two of its three most expensive hurricanes, and its most expensive winter storm (NOAA, 2022). The percentage of state’s total historic weather and climate disaster losses that occurred in the last 5 years is shown in Figure 3.
Figure 1 // Billion-dollar disasters across the U.S. are growing in number and severity
(data source: NOAA, 2022).
Figure 3 // Percentage of state’s total historic losses from weather and climate disasters in last 5 years (total losses shown in text)
(data source: NOAA, 2022).
Figure 2 // Billion-dollar climate- and weather-related disasters accounted for 80 percent of disaster-related losses, totaling $2.2 trillion from 1980-2021 (shown in $billions below).
(data source: NOAA, 2022).
About this Report
This report reviews the historic and projected economic toll of weather and climate disasters across the United States since 1980. It assess trends related to specific types of disasters—such as wildfires or hurricanes—as well as across regions, sectors, and over the course of decades. Such an analysis inherently reflects uncertainty associated with both historic impacts, for which data can be limited, as well as for future projections, which depend on future emissions scenarios and complex climate modeling. This analysis largely discusses total economic impacts of these disasters, but this metric is somewhat limited as well: it may be much harder for a low-income household to recover from the flooding of a less expensive house than for a wealthier household to recover from damage to a more expensive house, even if the total monetary damage of the latter is larger. Given these limitations, the report still aims to summarize the scale of weather and climate damage across the United States, the risk of escalating costs in a warming climate, and the need to rapidly invest in both climate mitigation and adaptation.
Disproportionate Impacts
Low-income communities, communities of color, and other historically underserved and overburdened face elevated risks from climate change. Recent research has found that future flooding is more likely to occur in low-income neighborhoods, communities of color, and places with a disproportionate share of industrial pollution (Marlow, 2022). Historically redlined communities which are still disproportionately home to people of color are more likely to be heat islands today (Plumer & Popovich, 2020), increasing risks for these populations as temperatures rise. Not addressing these inequities in climate policy risks exacerbating environmental health and socioeconomic inequities (Shonkoff et al, 2011), but targeted investments co-designed with communities can help reduce the disproportionate impacts of extreme weather (NASEM, 2022).
Author:Old Guy 2/8/2023 11:23:31 AM
Reply to: 2764530
NOAA reports about the rising global temperature that covers 46 years. Some intelligent gent noticed that according to the report there is NO Global Warming for the last 8 years. TRUE, ACCORDING TO THE RECENT REPORT BY NOAA. Even some of the links you have posted explain this!
Author:Old Guy 2/8/2023 4:42:04 PM
Reply to: 2764583
All of the information to prove that the temperature has not increased for 8 years is in the preceding post. Even a fact checker that objects to only using the last 8 years of the chart to make the point. And the point is true!
Read the posts, and do your own research, useful idiot.
Author:bladeslap 2/8/2023 6:09:49 PM
Reply to: 2764609
I dont; know if you have an issue reading or you purposely mislead us, so that's why I ask you to POST A LINK to your proof - If not, then you have zero credibility.
You just posted that Biden only created 2 million jobs - I fact checked it and went directly to the Bureau of Labor Statistics web site and again, you are completely wrong ...
It gets tiring sifting through your arguments as they are never backed by fact - You are wrong about pretty much everythiing you post, then you move onto the next one.
Suggest when you want to make an argument, post a link to backup your assertions rather than post your opinion.


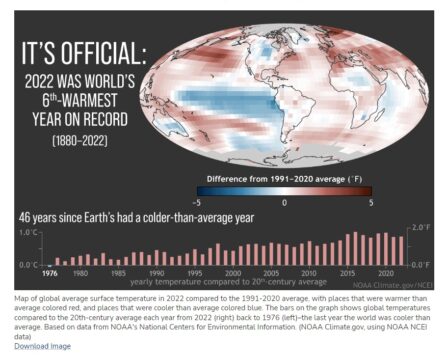 Graphic from the National Oceanic and Atmospheric Administration’s Jan. 12 press release.
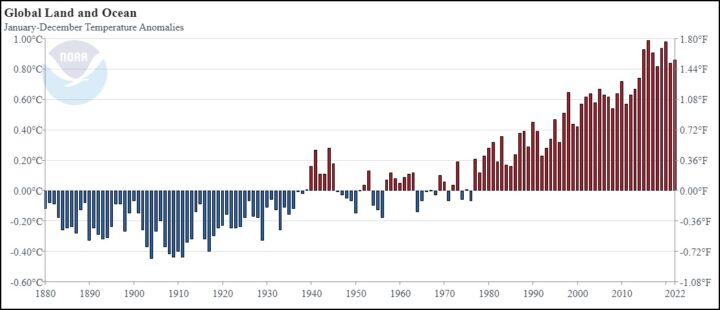 Graph from NOAA’s 2022 global climate report showing annual temperatures compared to the 20th century average.
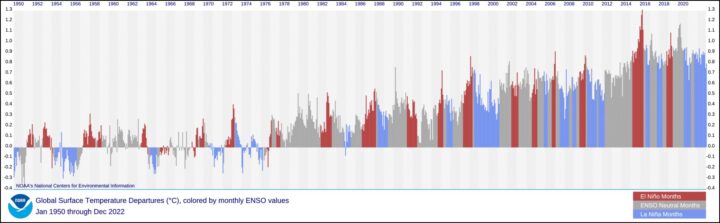 Graph from NOAA’s 2022 global climate report showing global temperatures compared to the 20th century average with El Niño and La Niña months highlighted.