
It was the whopping-yet-still-disappointing 6.5% annualized growth number for the second quarter that got most of the attention when the U.S. gross domestic product report came out Thursday. But the data release from the Commerce Department’s Bureau of Economic Analysis also included revisions to GDP and related measures back to 1999, making this an opportune time to take another look at economic growth under Donald Trump and his predecessors.
This is, let’s be clear from the start, not a perfect way of measuring presidential economic performance. There are lots of things that determine economic growth rates other than who is in the White House, and when a president does make a difference the results may be felt long after he’s left Washington. Still, it’s a widely used metric and Trump was downright obsessed with it, so here goes.
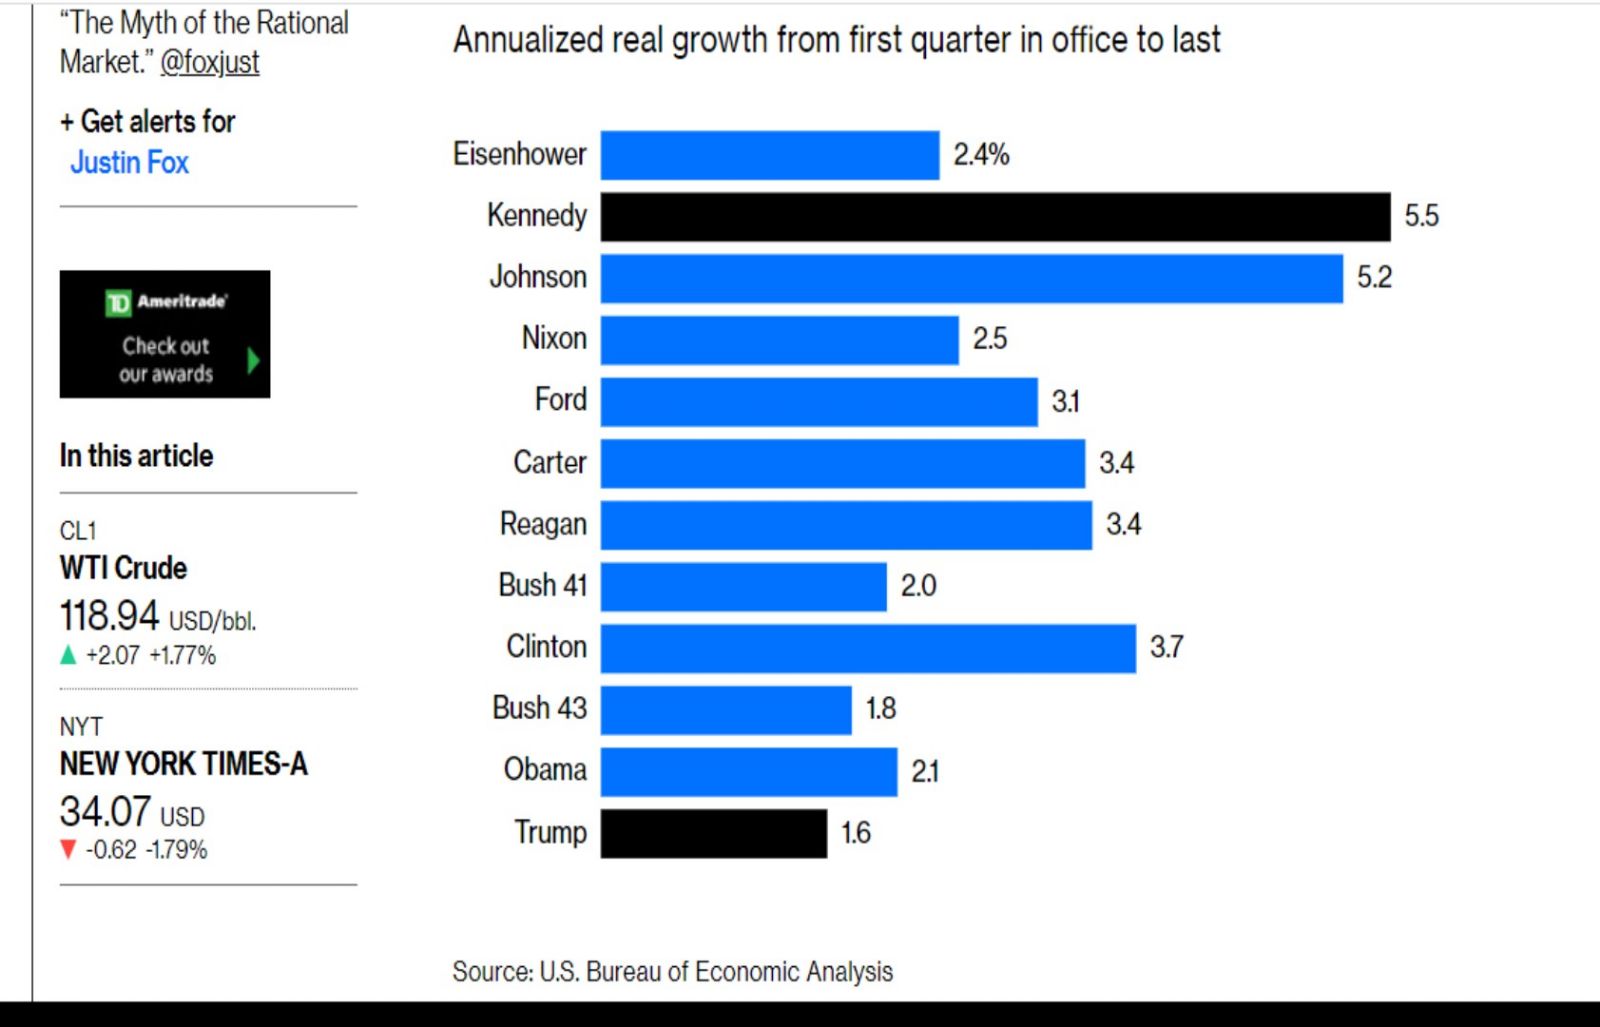
OK, maybe that GDP obsession didn’t work out so well for Trump. The chart starts with Dwight Eisenhower because his was the first presidency for which the BEA has full quarterly GDP data. Annual GDP numbers go back to 1929, and if you measure from Herbert Hoover’s first year in office (1929) to the year he left (1933), annualized growth was negative 7.4 percent. So Trump did a lot better than that! But his was the worst GDP performance since then (measured the same way as with Hoover, annualized GDP growth was 9.1% under Franklin Roosevelt and 1.8% under Harry Truman).
This does seem a bit unfair, given the pandemic and all. Trump didn’t always rise to the challenges posed by Covid-19, but thanks in part to legislation he signed and a vaccine-development program his administration put in motion, the U.S. economy has experienced one of the world’s quicker recoveries. Lots of other presidents have suffered economic setbacks due to events outside their control, of course, and you can’t just ignore a quarter or two because they were affected by bad economic luck. But there is something to be said for trying some other ways of measuring growth during his term.
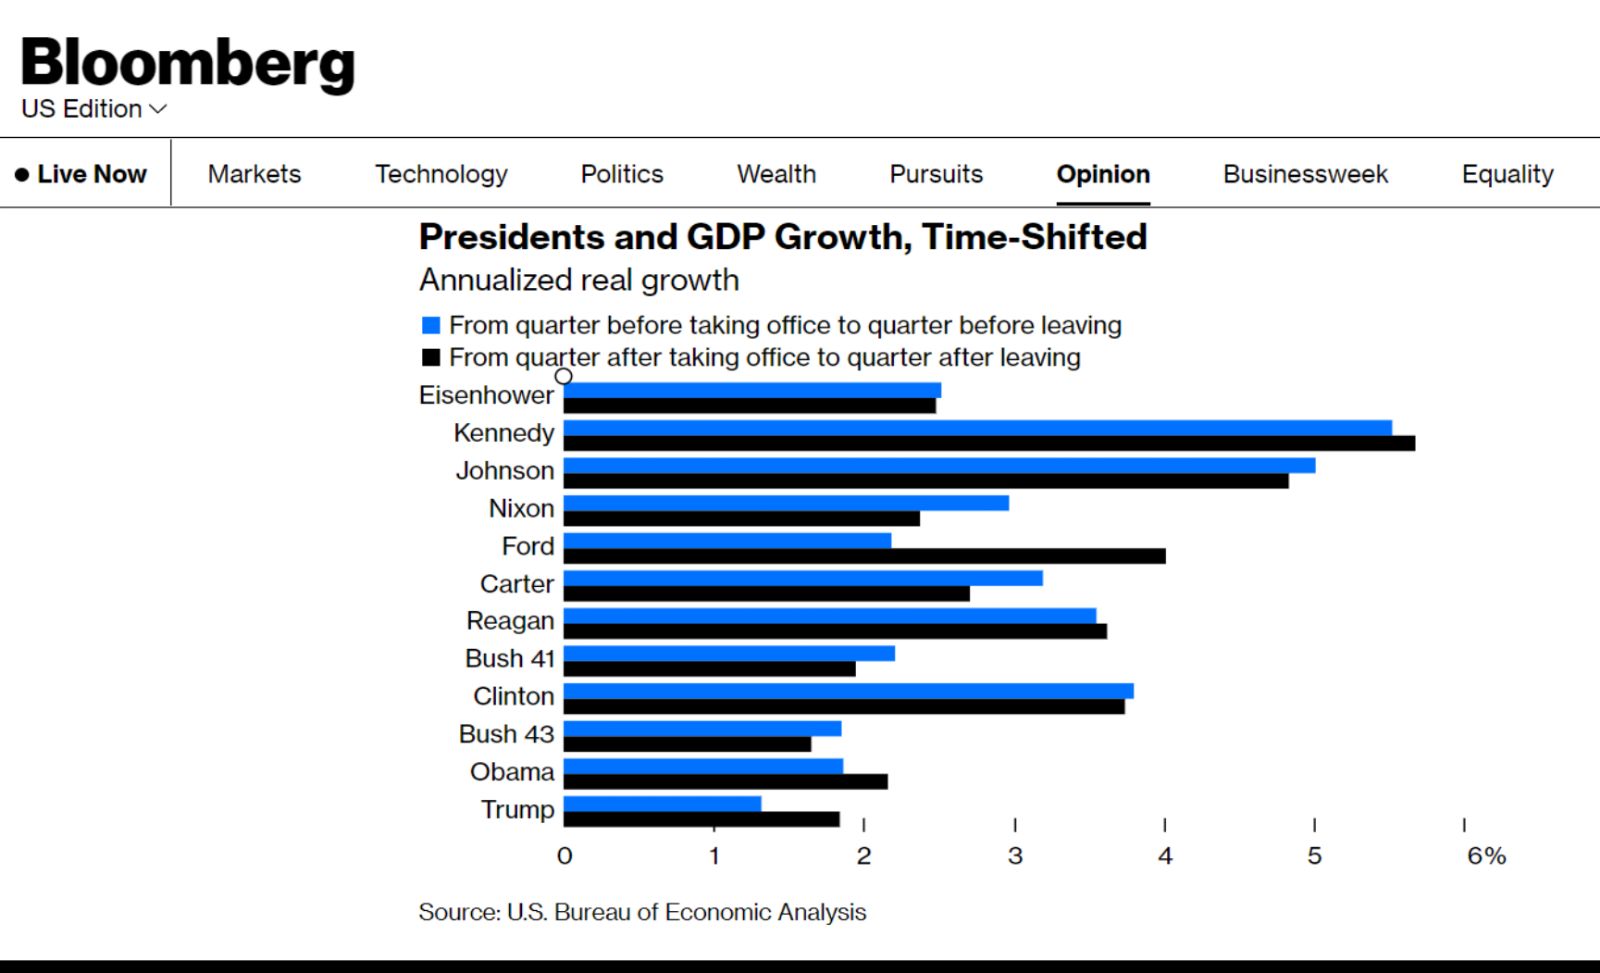
One is to adjust the timing. For the above chart I’ve taken real GDP in the quarter a president entered office and the quarter he left, and calculated the compound annual growth rate from one to the other. Here’s what it looks like if you shift that back or forward by a quarter.
Presidents and GDP Growth
Annualized real growth from first quarter in office to last
Presidents and GDP Growth, Time-Shifted
Presidents and Economic Growth
Annualized real growth in the average of gross domestic product and gross domestic income from first to last quarter in office
Source: U.S. Bureau of Economic Analysis
It looks a lot better for Trump (not to mention Barack Obama, and Gerald Ford) if you shift a quarter later, although this still puts him behind everyone but George W. Bush. There’s an argument for shifting the measurement period even later, given how long it can take for the effects of economic policies to be felt, but there’s also a point beyond which that starts to get a little ridiculous, plus we don’t have the data yet to do that for Trump.
Another adjustment involves incorporating the BEA’s estimate of gross domestic income, which in theory should be equal to gross domestic product but is compiled from different measures and never comes out quite the same. It has been argued that an average of GDI and GDP captures the timing of economic activity better than GDP alone does, so here’s what that looks like.
This puts Trump ahead of both George Bushes, although still trailing everyone else.
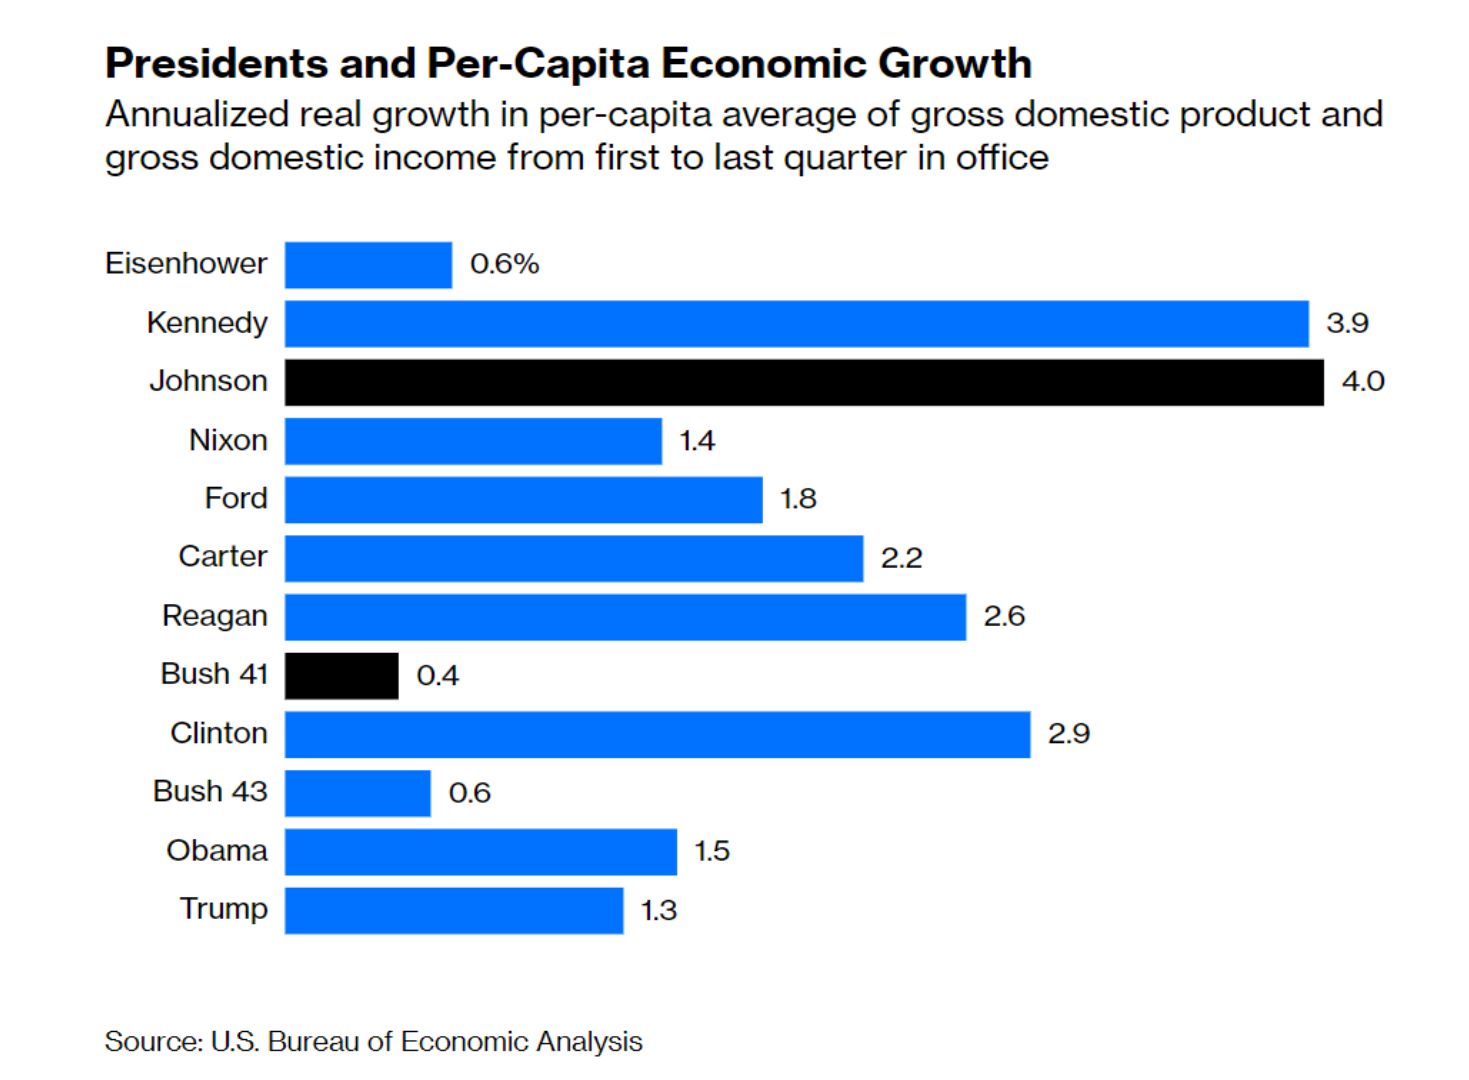
Economic growth is generally lower than it was a few decades ago, and this is probably not the fault of a particular president. One likely cause is the slowdown in population growth. Correct for that using the BEA’s quarterly estimates of U.S. population, and it brings a few more changes.
Presidents and Per-Capita Economic Growth
Annualized real growth in per-capita average of gross domestic product and gross domestic income from first to last quarter in office:
Source: U.S. Bureau of Economic Analysis
The rapid population growth during Eisenhower’s time in office (1.8% per year, highest among the presidents on the chart) consisted almost entirely of babies, who tend not to be big economic contributors from the get-go, so I would advise cutting Ike some slack here. In the past I have tried using the Bureau of Labor Statistics’ monthly estimates of 16-and-older civilian population to get around this, but for reasons involving the end of the Korean War and the fact that the BLS estimates exclude uniformed military personnel, that doesn’t entirely bail him out either. For Trump, factoring in population growth puts him well ahead of three presidents (Eisenhower and the Bushes) and not far behind Nixon and Obama, although still nowhere close to top performers such as Lyndon Johnson, John Kennedy, Bill Clinton, Ronald Reagan and, ahem, Jimmy Carter.
All of those top performers except Reagan were Democrats, which has not gone unnoticed by economists. Over the nearly 75 years for which we have reliable quarterly GDP and monthly jobs numbers, the growth of both has been markedly faster during Democratic presidencies than Republican ones. In 2016 the very eminent Alan S. Blinder and Mark W. Watson of Princeton undertook “An Econometric Exploration” of this phenomenon for the American Economic Review and came to the not especially helpful conclusion that:
the Democratic edge stems mainly from more benign oil shocks, superior total factor productivity (TFP) performance, a more favorable international environment, and perhaps more optimistic consumer expectations about the near-term future.
Trump offered hints of a different economic approach, but the signature legislative accomplishment of his term was another big tax cut and his growth numbers will drag the Republican averages down even further. Maybe it’s mostly bad luck. This is getting to be an awfully long run of it, though.
This column does not necessarily reflect the opinion of the editorial board or Bloomberg LP and its owners.


 +3/-0 TheCrow 6/3/2022 12:58:40 PM